In almost every game, announcers find a point to mention each team’s third down conversion rate. Sometimes it’s their conversion rate for that game only, and sometimes it’s their conversion rate for the whole season and a ranking of how that compares to other teams. In these situations, I find the information lacking: they say a team has a 25% third down conversion rate, but the play they’re about to run on the field is a third and 1. Does that play really have a 25% chance of getting them one yard (or more)? I don’t think so, but I have nothing else to go by. Taking the actual play context into consideration, just the distance to go, really, is tremendously easy but not often done by analysts.
All third downs are not created equal, we know that, so in this article I will be presenting my findings from the 2020 season about third down conversion rates after adjusting for the yards to go to the first down marker. There are two reasons for doing this. The first is what I mentioned previously: we want to know the conversion rate for the situation we are in, not every third down ever. And second: we can learn which teams are actually good at third downs (after adjusting for yards to go), and which teams are just good at getting to third and short situations. There is a big difference there, and it’s possible that teams look to be good on third downs because they get themselves into third and short situations, and not because they are actually better than other teams at third down plays themselves.
A quick note on the data: for this analysis, data from the 2020 season was used. Teams were included if they had at least 50 total third down attempts, and at least 10 attempts in each of the subcategories of third downs explained next.
The first thing I did was separate all third down attempts into different buckets. Third and 1&2 yards-to-go were grouped together, and so were third and 3&4, third and 5&6, third and 7&8, and third and 9&10. This helps us separate the different third down situations teams were in. Anything longer than third and 10 was left out.
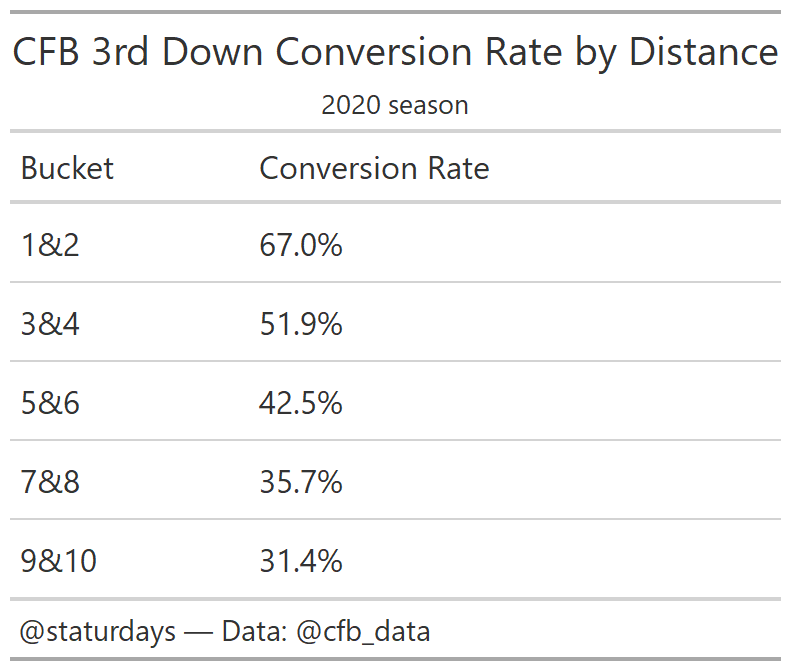
Looking at the whole of college football, below are the third down conversion rates by the different distances to go.
Now that we have the average third down conversion rates for all teams at these difference distances, we can compare that to the third down conversion rate at different distances for an individual team. This tells us, adjusting for yards to go, who is actually performing best on third downs. I looked at this by comparing each team’s third down conversion rate at different distances to the league average, and calculating their conversion rate above or below average.
The team that outperformed the average of a distance bucket the most was Stanford on third and 9&10. They had a conversion rate of 63.6% at this distance compared to the league average of 31.4%, for a +32.2% conversion rate compared to the league average. They played a shortened, six game season this year, but met the minimum number of plays to be included in this analysis. USC performed the best on third and 5&6 with a +29.9% conversion rate, Florida was best on third and 7&8 at +29.3%, Cincinnati was best on third and 3&4 at +26.6%, and UCF was best on third and 1&2 at +25.6%.
We can also look at this visually, comparing each teams’ conversion rate above or below average at each bucket distance. In addition to their conversion rates, I also plotted their average distance to go on all third downs above or below average on the y-axis. The average third down distance to go was 5.35 yards, so being “below average” is better for this stat because it means their average third down was shorter than the league average. This further helps us answer the question of who is good on downs one and two at getting to a manageable third down situation and who is good at converting those third downs after adjusting for distance.
Here is that chart:

You’ll notice that the location of a team along the y-axis stays the same throughout all of these plots, and that’s because I calculate the average yards to go for all third downs for that team, not separated out by distance. This way we can see which teams are setting themselves up for success on third downs overall, and then at each grouping level (1&2 to go, 3&4 to go, etc.), who is executing.
- Being in the upper left hand box means that a team is above average (worse) at average third down yards to go, and below average (worse) at converting third downs at that bucket’s distance.
- Being in the upper right hand box means that a team is above average (worse) at average third down yards to go, and above average (better) at converting third downs from that bucket’s distance.
- Being in the lower left hand box means that a team is below average (better) at average third down yards to go, and below average (worse) at converting third downs from that bucket’s distance.
- Being in the lower right hand box means that a team is below average (better) at average third down yards to go, and above average (better) at converting third downs from that bucket’s distance. This is the best box to be in.
Syracuse and Michigan are the two standout teams for having long third downs, and Syracuse is also below average on converting third downs at each distance. Interestingly, they were worst out of Power 5 and Independents at third down and 1&2 by a large margin, converting only one third of their third and short attempts.
Ohio State was particularly good at getting to third and manageable situations with an average yards to go of 4.8 yards, -0.6 yards below the league average. They also converted their third downs at an above league average level at every distance, converting 20% more often than average on third and 3&4 situations.
There are a ton of team specific insights we could draw from this chart and the data, but I will save those for you to look through or future me. One thing that teams could look at is what play calls are resulting in their success or failure at different distances. Are RB draws hurting Syracuse on third and short and they should be calling something else? What are the best teams doing to increase their success outside of their personnel? This is something that teams can situationally adjust to and learn from. Overall, there are a couple of key points I took away from this.
First, we should be looking at team conversion rate by distance more so than looking at conversion rate overall. We all know a third and one is not equal to a third and eight, so let’s start talking about that more. You can even use different buckets if you like and separate out things differently, but let’s start separating at least. Even splitting the conversion rate out by third and 1-5 vs. third and 6-10 would be super useful to know when you’re watching a game.
Second, I think there is usefulness in this for success rate. We look at success rate as equal for all teams. If you gain 70% of the yards-to-go on second down, the play is considered successful. The idea is obviously that successful plays on downs one and two set you up for a manageable third down. But what’s manageable? As we’ve seen here, it’s different for every single team. A third and 3&4 is not “manageable” for Michigan State, who converted from that distance on just 25% of attempts this season (-27% compared to the league average). They were not truly “successful” on earlier plays if this is the situation they put themselves in, despite what success rate might tell you. Conversely, if you’re Alabama or Baylor, a third and 5&6 is quite manageable with a 66% conversion rate for the former (+24%) and a 62% conversion rate for the latter (+19%) this season. They don’t need to run any “successful” plays by the definition to set themselves up for a nearly two-thirds chance of making a third down conversion. Success rate is useful, but some more fine tuning could go a long way, as a successful play for one team might be not all that helpful for another. This is an idea I’m still working on, so if you have any ideas about how we can improve success rate, I’d love to discuss more in the comments or on Twitter @Staturdays.

Leave a comment