
There are a lot of advanced college football stats out there—it can be confusing and even intimidating without a glossary. Here is your definitive college football statistics guide, with definitions to some of the most common advanced college football stats.
Team Statistics
FEI – Fremeau Efficiency Index
Highlights:
- Opponent-adjusted
- Per-possession efficiency
- Gives the scoring advantage per possession against an average opponent on a neutral field
FPI – Football Power Index
Highlights:
- Developed by ESPN
- Designed to measure team strength and project it going forward
- ESPN’s stated goal is not to rank teams but to correctly predict games and seasons
- Broken down into offense, defense, and special teams contributions
- Represents how many points above or below average a team is
FPI is a number that can be positive or negative, and can be interpreted as the number of points a team would win (or lose) by against an average opponent on a neutral field.
Example: Ohio State’s FPI is 30. So, against the most average team in the FBS, they would be expected to win by 30 points on a neutral field (say, in a bowl game).
Elo
Elo Ratings are Staturdays’ main metric for rating teams and predicting win probabilities for single games and win totals for the season.
This simple metric looks at a few factors in the result of a game to increase or decrease a team’s rating each week.
Each Power-5 team starts at an Elo rating of 1500 at the start of the 2000 season, and then that score goes up or down based on wins and losses against other teams. At the end of the season, every team is brought back 5% closer to the league-average of 1500 again, to account for changes in the offseason.
You can read more about Elo ratings and how we calculate them in detail here.
Player Statistics
Completion Percentage Over Expected (CPOE)
Highlights:
- Quarterback stat
- Used to measure the difference between a player’s actual completion percentage, and what a model would expect their completion percentage to be, based on averages of other quarterbacks’ performances over many years and hundreds of thousands of passes.
- Usually requires advanced data to calculate
Definition:
Anytime you see the word “expected” or “expectation”, just think “average”. That’s all it really is, is an average of what other players have done in similar situations. In the NFL, they use GPS tracking data to get a really detailed look at each pass and determine the probability of completing the pass based on things like:
- Receiver separation from the defender
- Depth of target in yards downfield
- Quarterback separation from the nearest pass rusher
In college, that data isn’t usually available, but you can still use some less-detailed tracked data about the play to generate a good estimate:
- pass location (e.g. deep left, deep middle, shallow middle, etc.)
- quarterback pressure
So you feed a model a bunch of plays with various QB pressure rates, pass locations, and anything else you think will be helpful, and it’ll see what the average completion rate is in those different situations. Then, you can provide it a pass that it doesn’t know the completion status of and it will use all that data it learned on to predict the probability of a completion.
You can do this for every pass a player makes, and then compare it to the actual result of the pass (1 for completed, 0 for incomplete). Then, you average all the differences between the probability of completion and the actual result of the play, and that number is your completion percentage over or under expected.
Example:
A player throws a Hail Mary with a completion probability of 7%. It’s caught. The actual completion rate for that pass is 1, for a CPOE of +93%!
Now, a player throws 100 passes over a few games. The average completion probability of their passes was 65%. The player’s actual completion rate over those games was 59%. Their CPOE is -6%. In this case, they’ve underperformed vs. the expectation.
Game Statistics
Win Probability
We use our Elo ratings to calculate the probability each team has to win their game. We add in a slight home field advantage as well that accounts for an extra 8% increase in win probability for two otherwise evenly matched teams.
Post-Game Win Probability
This is a measure of how likely a team was to win a game based on how the played during the game. One way to find this is to take an average of their in-game win probability throughout the game. So if a team had a 50% chance to win the game for 1 quarter, and then pulled away and had a 90% chance to win the game for the last 3 quarters, they’d have a post-game win probability of 80%.
Another way to measure this stat is by taking some key stats throughout the game, like average success rate, third-down conversion percentage, average starting field position, etc., and use those to estimate how likely they were to win that game. Basically, you can look at thousands of historic games where a team had a 70% success rate and a 35% third-down conversion rate and see that they won 85% of the time, and that is your post-game win probability.
This stat is useful in determining how dominant a team was during a game, how impressive their performance was, and how lucky or unlucky they were to win or lose the game. For instance, if a team wins a game but only had a 10% post-game win probability, that means they won despite playing poorly, and therefore are lucky to have won. If a team has a 90% post-game win probability and loses, that means it’s a really unlucky loss and that nine times out of ten, they win a game where they play that well.
Play Statistics
EPA – Expected Points Added
Highlights:
- Per-play stat
- Measure of points added (or lost) on each play compared to the expected value
- Accounts for the expected points for the remainder of the drive, and the opponent’s next drive
- Takes into account down, distance to go, yardline
Definition:
Expected Points Added, or EPA for short, is the number of points added or lost on any given play, vs. the expected number of points that most teams score (or give up) in the current drive (if they score) or next drive (if they turn the ball over). It is based on an average of all teams in similar down and distance situations.
Example:
On 4th and 10 from your own 20 yard line, the expected points are -0.32 points, meaning that on average, teams in this position on the field will give up an average of .32 points to the opponent within the next drive.
Let’s say this team ends up going for it on this 4th and 10 (they’re desperate) and break off an 80 yard TD run. The result of the play is 6 points, vs. and expectation of -0.32 points, leading to an EPA of +6.32 on that particular play. The team scored 6.32 points more than expected.
There doesn’t need to be a score on the play to get an EPA. If that same team gains 15 yards and gets a 1st down, their new expected points from 1st and 10 at the 35 is 1.76, a 2.08 point improvement from the previous play. +2.08 is their EPA for that play.
PPA – Predicted Points Added
Highlights:
- Per-play stat
- Measure of points added (or lost) on each play compared to the predicted value
- Accounts for the predicted points for the remainder of the drive, and the opponent’s next drive
- Takes into account down, distance to go, yardline
Definition:
This is the same as EPA with one key difference: this stat uses predicted points instead of expected points. All this means is that is uses projected points instead of the actual average points scored on a drive. If you think back to stats class, expected value is just a fancy word for the average, or mean. Meaning, take all the results on all the drives with all the same situations, and then take the average. For PPA, we use a variety of stats to predict how many points the drive will end in. It uses a neural network model instead of historic data.
Win Probability Added (WPA)
Highlights:
- Using our in-game win probability model, this is the difference between a team’s win probability pre-play and post-play.
- This can be used to see whether any individual play helped a team’s chances of winning or hurt them
Example:
You can look at any team and see how they perform in different situations. For instance, you could look only at plays where Penn State goes for it on 4th down, and then see what their average win probability added (WPA) is. If it’s positive, than that means they tend to improve their chances of winning the game by going for it – either because they execute well or because they go for it in the right situations. You could then compare that to the average of all college football teams to see if they’re better or worse than average on 4th down plays.
Line Yards
Highlights:
- Way of measuring the Offensive Line’s contribution to the run-game
- Simple weighted measurement of run plays
Definition:
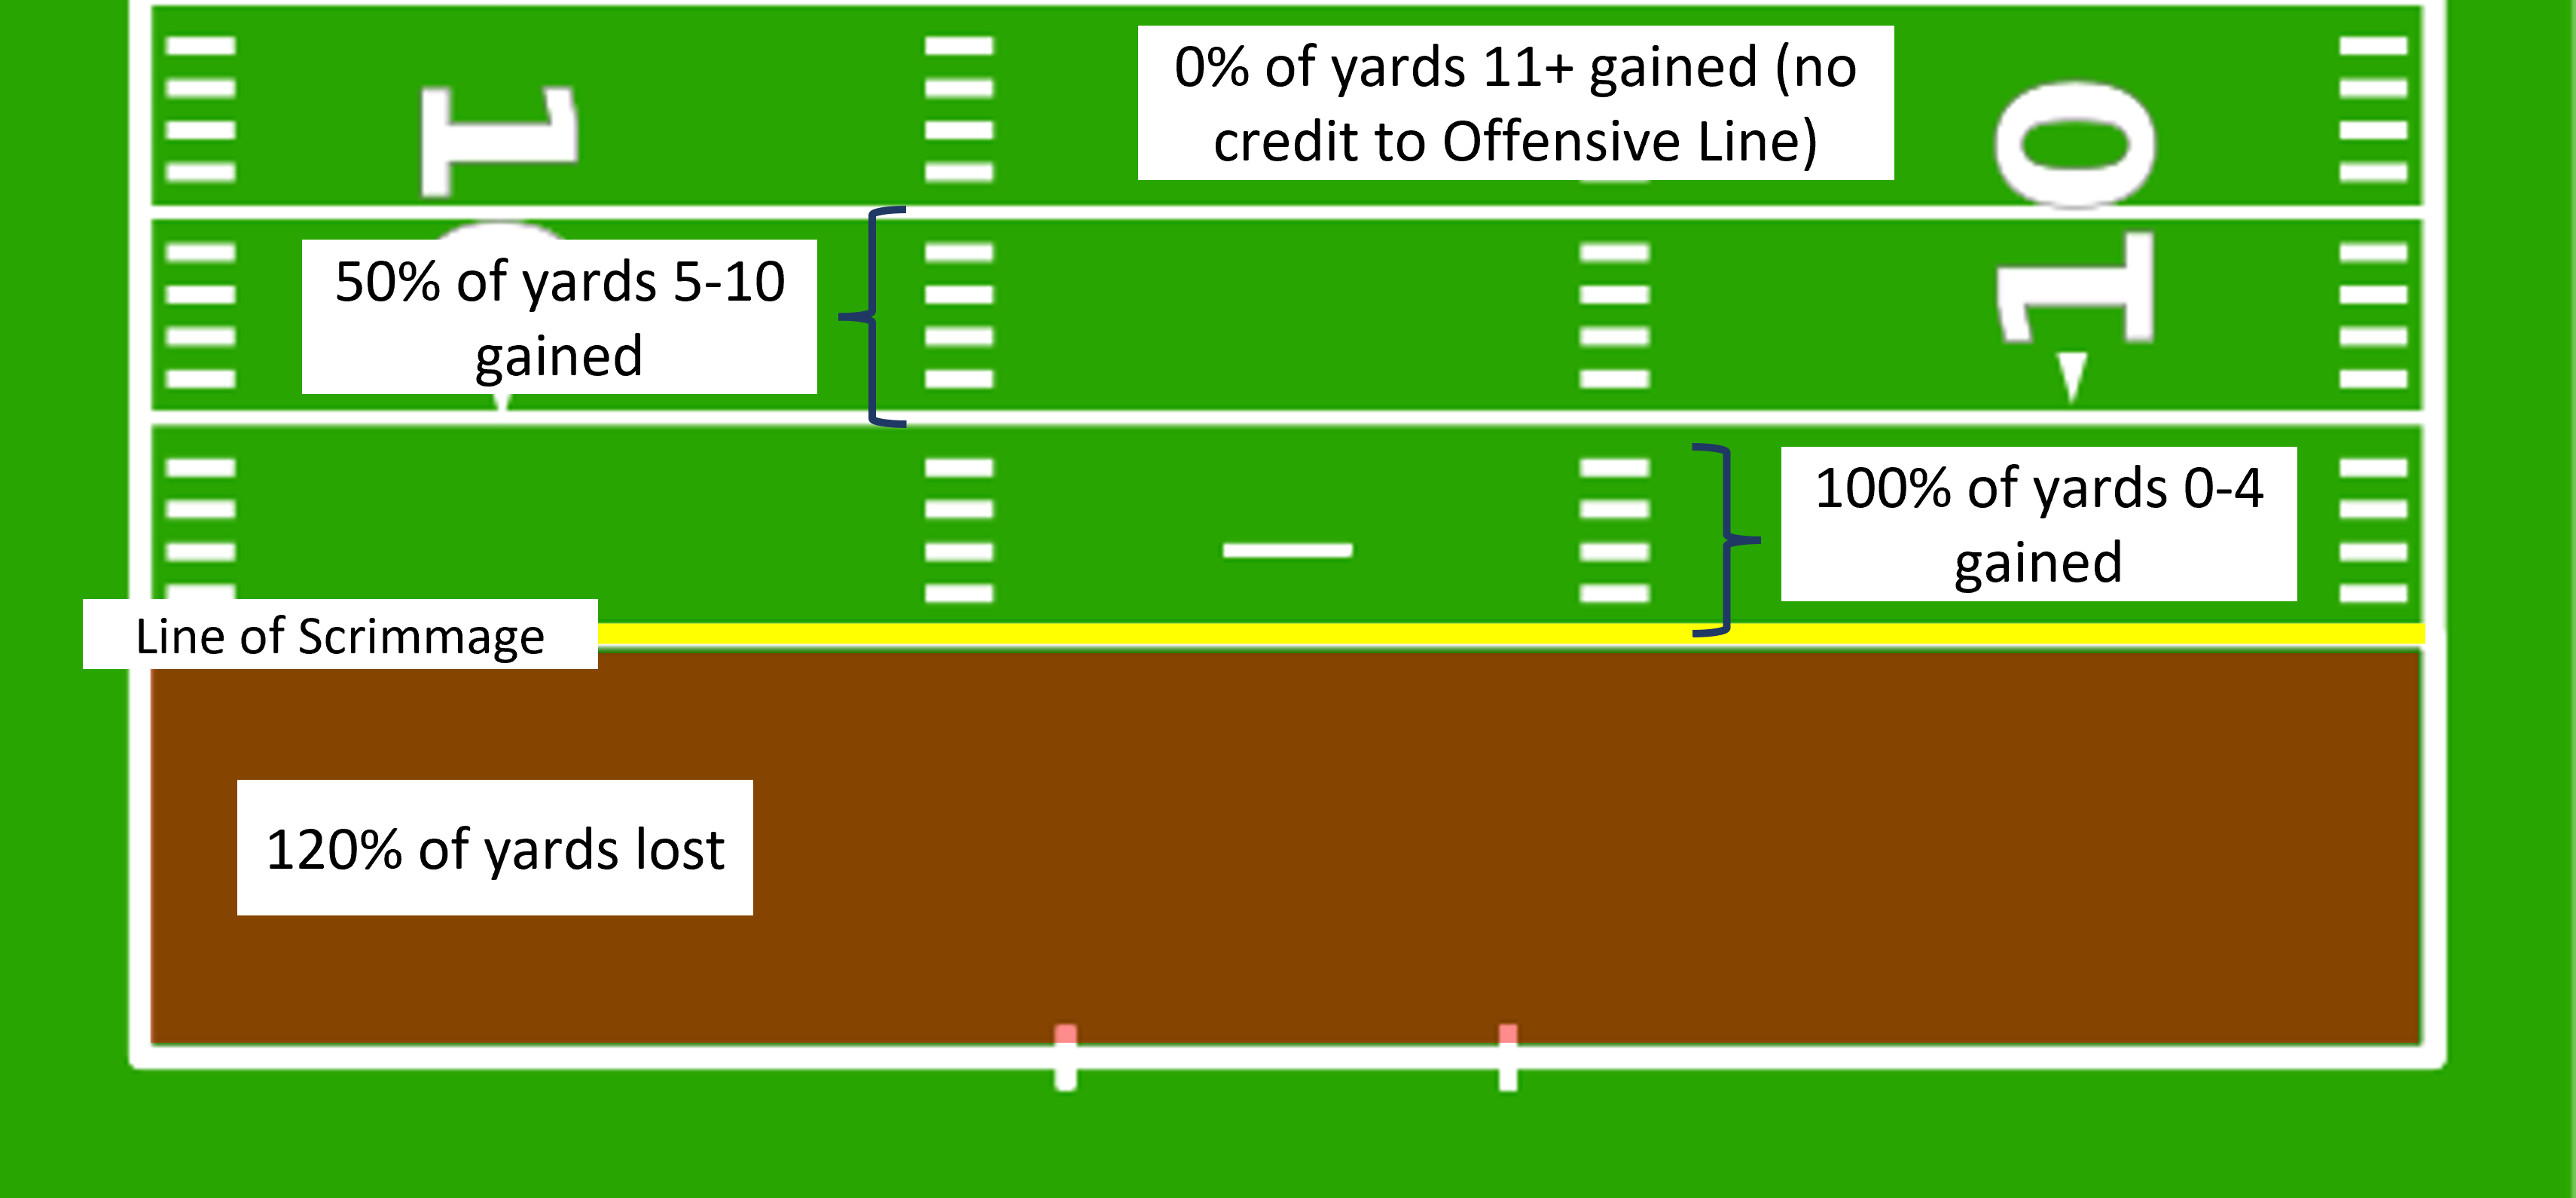
Line Yards is just a simple calculation that gives you an idea of how much the Offensive Line had to do with the success/failure of a run. The theory is that the first few yards of a run are mostly thanks to the gap opened up by the offensive line, but then anything beyond 5-10 yards is mostly due to the skill and speed of the running back. Therefore, the formula is…
For runs that lose yards:
- Line Yards = 1.2 * Yards Lost
For all positive runs:
- Yards 0-4 = 1 * Yards Gained
- Yards 5-10 = 0.5 * Yards Gained Yards
- 11+ = 0
So you apply the calculation to pieces of the entire run.
An example is a 12 yard run by the running back. The rushing yards stat equals 12 yards. The Line Yards stat will equal 1 * 4 + 0.5 * 6 = 7, which is the max value you can get for the line yards stat on any given run play.
Explosiveness (Staturdays Definition)
Highlights:
- Fairly subjective stat
- This is the rate of rushes or passes that are in the top 10% of yards gained.
- For pass plays, this will work out to be about 19 yards or more
- For run plays, this is about a 12 yard gain or more
- One of the “five factors” as described by Bill Connelly
Explosiveness (EPA)
Highlights:
- Average EPA on “successful” plays (see Success Rate)
- A measure of “how good were your good plays?”
Success Rate
Highlights:
- A simple way of determining whether a play was successful or not, based on the percentage of yards to go gained.
A play is deemed “successful” when:
- At least 50% of the yards-to-go are earned on 1st down (i.e. 5 yds. on 1st-and-10)
- At least 70% of the yards-to-go are earned on 2nd down (i.e. 7 yds. on 2nd-and-10, or 5 yds. on 2nd-and-6)
- 100% of the yards-to-go are earned on 3rd and 4th down (i.e. you get a first down)
- A Touchdown would also be considered a successful play, no matter the yards-to-go
Win Probability Added (WPA)
Highlights:
- The change in win probability before the play versus after the play. Positive changes are good and mean a team improved their chances of winning on that play.
Definition:
WPA is a great tool for determining the value of any given play in terms of helping or hurting a team’s chances of winning the game. To be able to get win probability added, you first need to know the win probability of that situation on average.
To calculate this, you give a model thousands of college football plays, and each play is marked with whether the team would go on to win or lose that game. It evaluates all the data, looking at different situations:
- where the ball is on the field
- how much time is left
- which team has the ball
- how many timeouts each team has
- how good the team was rated before the game
- the down and distance
It learns from all of that and then spits out a win probability for any given play. It might say “In the 1st quarter with the ball on your own 25 and you’re down 7-0, you have a 49% chance to win the game.”
That 49% is the win probability at the beginning of that play before you snap the ball. Now let’s say the team throws a pick-six on that play and goes down 14-0. Well now, the model might say “In the 1st quarter if your opponent just scored a touchdown and you’re down 14 points, you have a 34% chance to win that game.” So the difference before and after that play is -15%. That’s your win probability added for that play. That interception hurt the team’s chances of winning greatly.
Example:
A team is down 2 points with four seconds left on the clock with the ball at their opponents 10 yard line. Teams in this situation should usually win the game. Kickers have maybe a 90% chance of making this field goal, so the model says your pre-play win probability is 90%.
Instead, your kicker shanks it. The game is over. Your win probability is now 0%. The WPA on the kick is -90%, a gut-wrenching blow.
