This is an excerpt from a recent edition of the Staturdays newsletter. Subscribe to get weekly content like this in your inbox.
Last week we talked at length about Moneylines. This week we’re talking spreads, a topic I tend to avoid. Reason: it’s a lot easier to predict which team is going to win, especially in college football—as opposed to the NFL where there’s more parity—than it is to predict how much they’re going to win by.
Vegas spreads are off by about 12.5 points per game, and Vegas has access to more data than you or I, or almost anyone in the public does. So it is a tall task to try to beat them at their own game. Today we’ll look at the economics of spread bets and what makes them so tricky.
A Moving Target
Believe it or not, Vegas doesn’t really need to get the lines right at all. They just need to get equal money on each side of them. So there’s advantage number one. While we need to be laser-accurate to make sure our prediction lands on the right side of the spread, Vegas is less concerned with that level of accuracy (although they are fairly accurate).
The reason for this is vig. Most spreads pay out around -110, or an implied probability of 52%. So, even though there’s only one right score in the end, the probability of +2.5 covering on either side adds up to about 104%. This means that even if something only happens 50% of the time, Vegas pays out like it happens 52% of the time. If you’re wondering where your extra 2% went, the answer is: the sportsbooks have it. That’s their commission fee for setting up the market, essentially.
We see this in moneylines too. Ohio State may have a 96% implied probability of winning, but Maryland will still have an 8% implied probability of winning too. Even though that’s not possible, it covers the sportsbook when the improbable does occur.
So back to getting an equal audience on both sides, this ensures that people bet on something that happens 100% of the time, but only pays at a discount as if it happens 104% of the time. Let’s look at an example of what happens when the audiences aren’t equal.
$100,000 total bet on game 1
Team A: -110, 50% of Public Money
Team B: -110, 50% of Public Money
Team A wins: $95,454
Sportsbook Profits: $4,546
$100,000 total bet on game 2
Team A: -110, 55% of Public Money
Team B: -110, 45% of Public Money
Team A wins: $105,000
Sportsbook Losses: $5,000
So now you can see why they want to balance the line. Even the slightest bit of the audience being off can lead to a loss on a matchup, because they have to pay out more than they took in. Of course, if the sportsbook is really confident in the line they set and they think that the public is wrong, then they could be looking at a big payday if the line is unbalanced in their favor, but I’m not sure if that’s a risk they like to take. This way is a sound strategy to consistently make money, no matter the result of the game.
Predicting the Spread
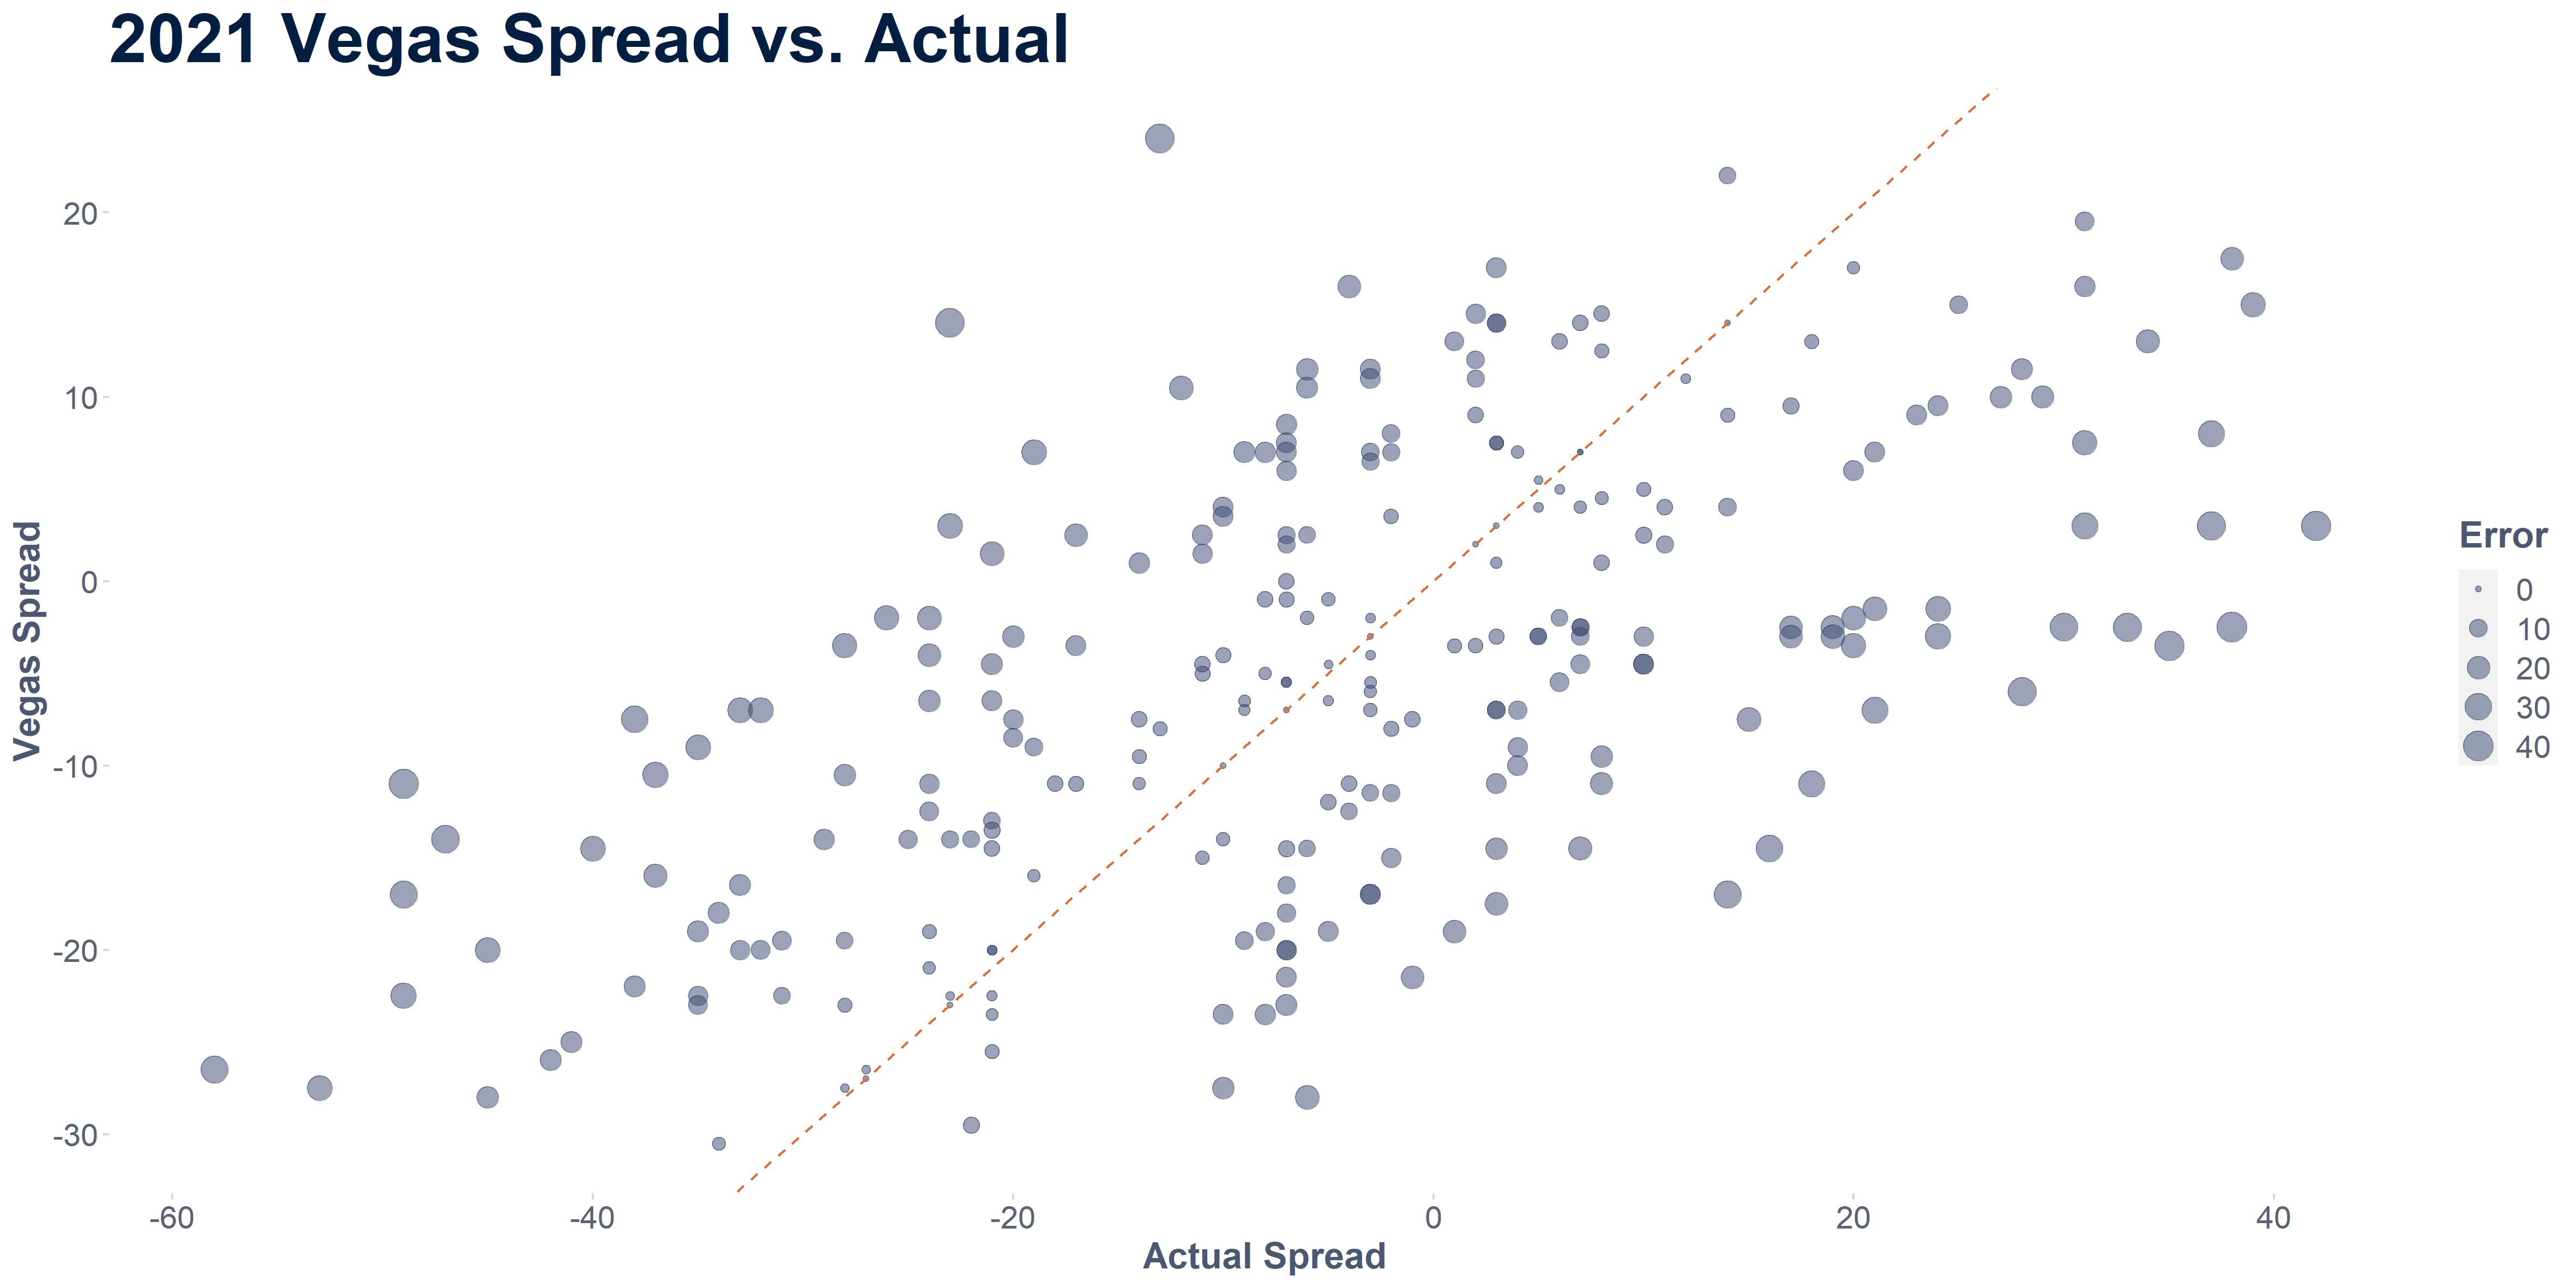
Last week, I showed you this chart of Vegas spreads vs. actual scores and it was surprisingly all over the place.
So let’s look at how elo differences correlate to actual spreads and see if it’s worth trying to use to predict spreads.
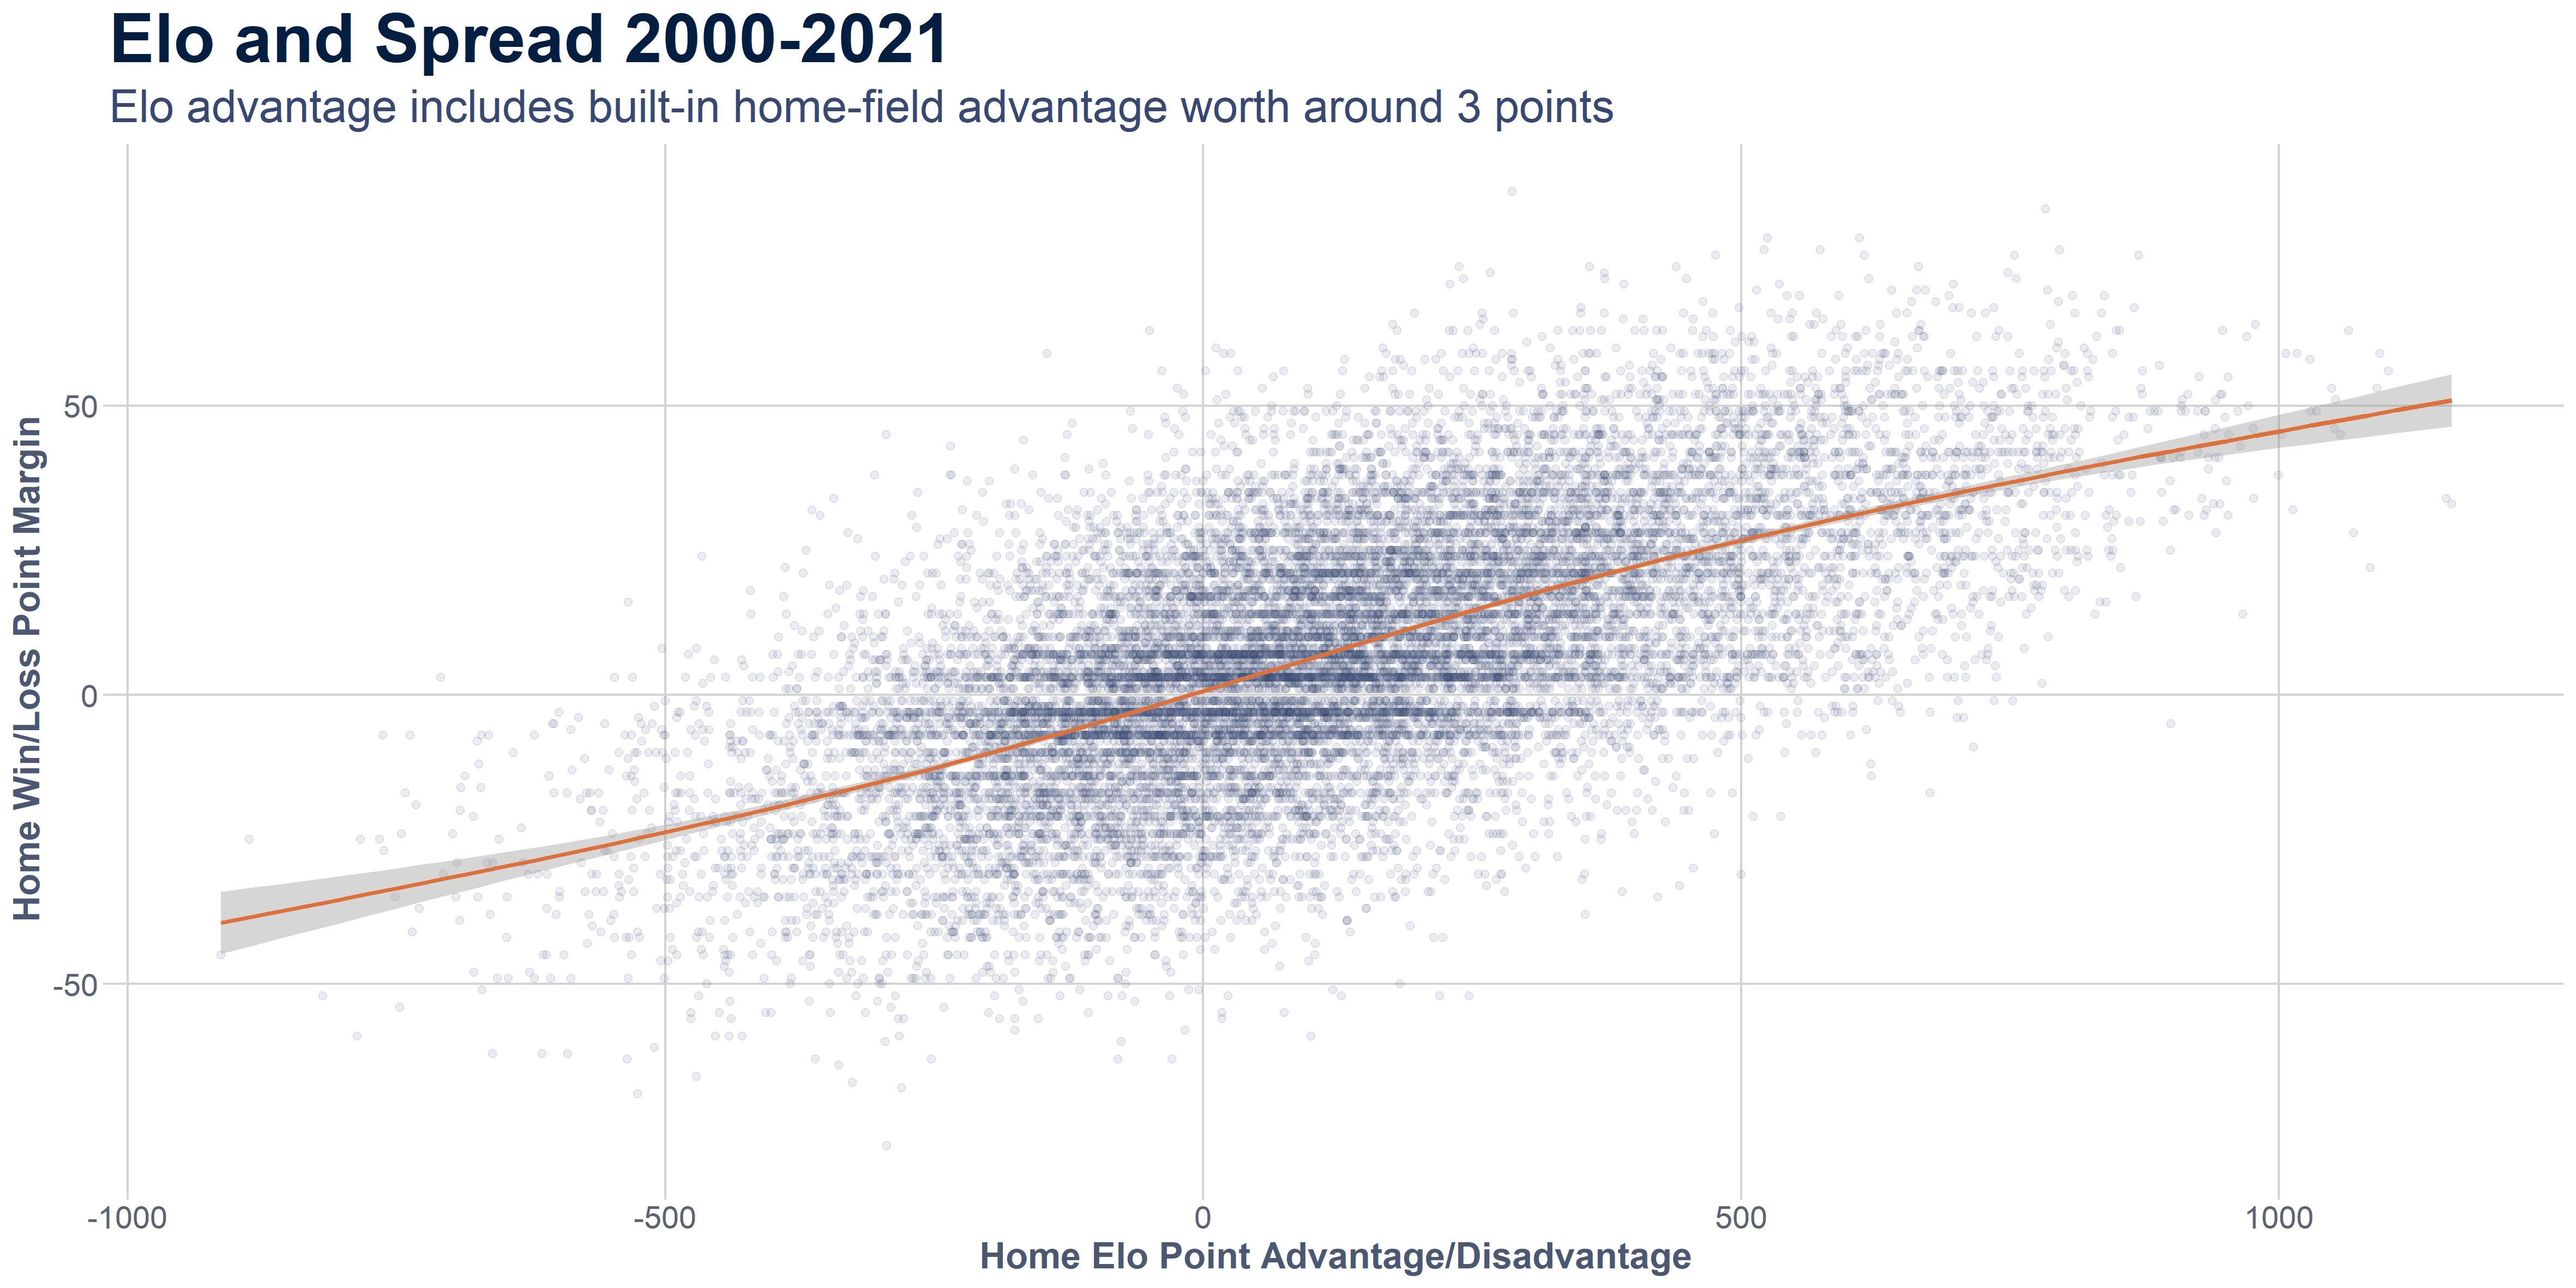
So we definitely have a clear linear relationship here. That’s good. We’re going to have a significant model. However the problem is the variance of the spread. It’s huge. The error on any given spread is going to be really wide. Let’s build the model and see what happens.
When we build the model, we get a highly significant model, but not a very accurate one. 50% of all the predictions fall within 11.5 points of the actual score, which is not bad, but the average error on all the data is closer to 17.3 points.
We also get a formula that tells us how many Elo points translate into 1 actual point in the game. Here’s the formula we get.
Home Team Actual Win Margin = Home Elo Advantage * .05 + .92
So, dividing 1/.05, we get 20 Elo points is equal to 1 actual point in the game. The .92 represents the intercept, or in our case, the number of points the home team will win by if their elo advantage is 0, meaning they’re evenly matched with their opponent. Keep in mind, we already include 55 Elo points as the home field advantage by default, so this would indicate that our home field advantage is actually too low. On average, home teams have almost a 4-point advantage all else being equal. That’s pretty incredible!
So if a team has a 1680 Elo rating and their opponent has a 1600 Elo rating, we’d predict the home team to win by 4.92 points.

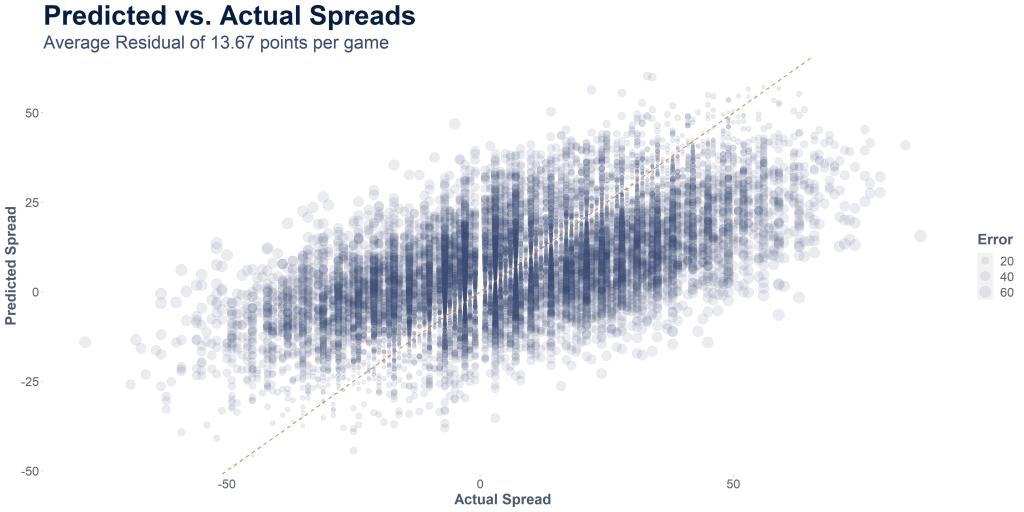
So really this is a very similar graph, but we’re just applying the model to the data (and the same data we trained the model on, which is generally a no-no). So even though the model has seen this data before, this is the best it can do given only the elo margin, leaving a lot of variability (almost 14 points to be exact.)
So we can’t really use this unless our spread is > 13 points different from the Vegas spread, which should very rarely be the case. That’s also only the average residual, so there’s still a good chance that our prediction is 17 or 20 points off, which won’t help us against Vegas. And even then, we’d wonder whether Vegas knows something we don’t with such a large gap in our predictions.
The Bottom Line
I hope I’ve painted a picture of why spreads are such a difficult bet to profit on. I’ll certainly keep an eye out for times when the spreads seem way off and there’s opportunity, but unfortunately those are few and far between.
Of course, we have the option of adding more data to our model. Elo is one factor and accounts for about 40% of variability in the spread, but maybe with more data we can more accurately predict spreads. Well folks, that’s what I’m working on right now, and so far I haven’t had much success. But I’ll keep plugging away looking for more data that is significant in helping predict spreads and winners, and update the model when it starts performing better.

Leave a comment