
This is an excerpt from a recent edition of the Staturdays newsletter. Subscribe to get weekly content like this in your inbox.
One glaring aspect of Elo is its stark contrast to the traditional AP Poll rankings. Just look at the two top 25’s: the first from the AP Poll and the second based on Elo ratings.
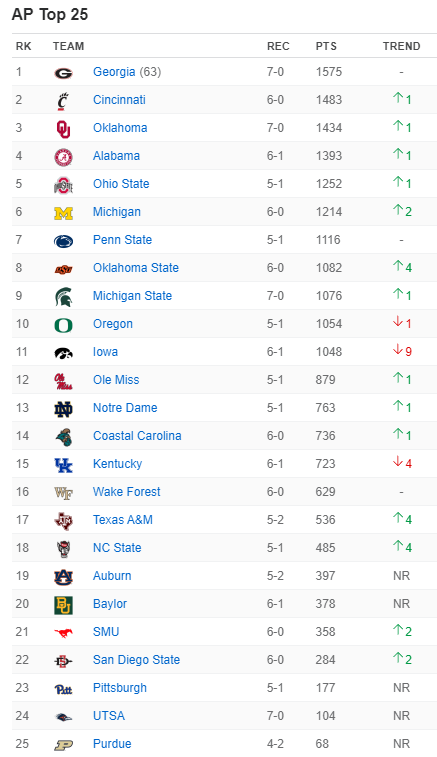
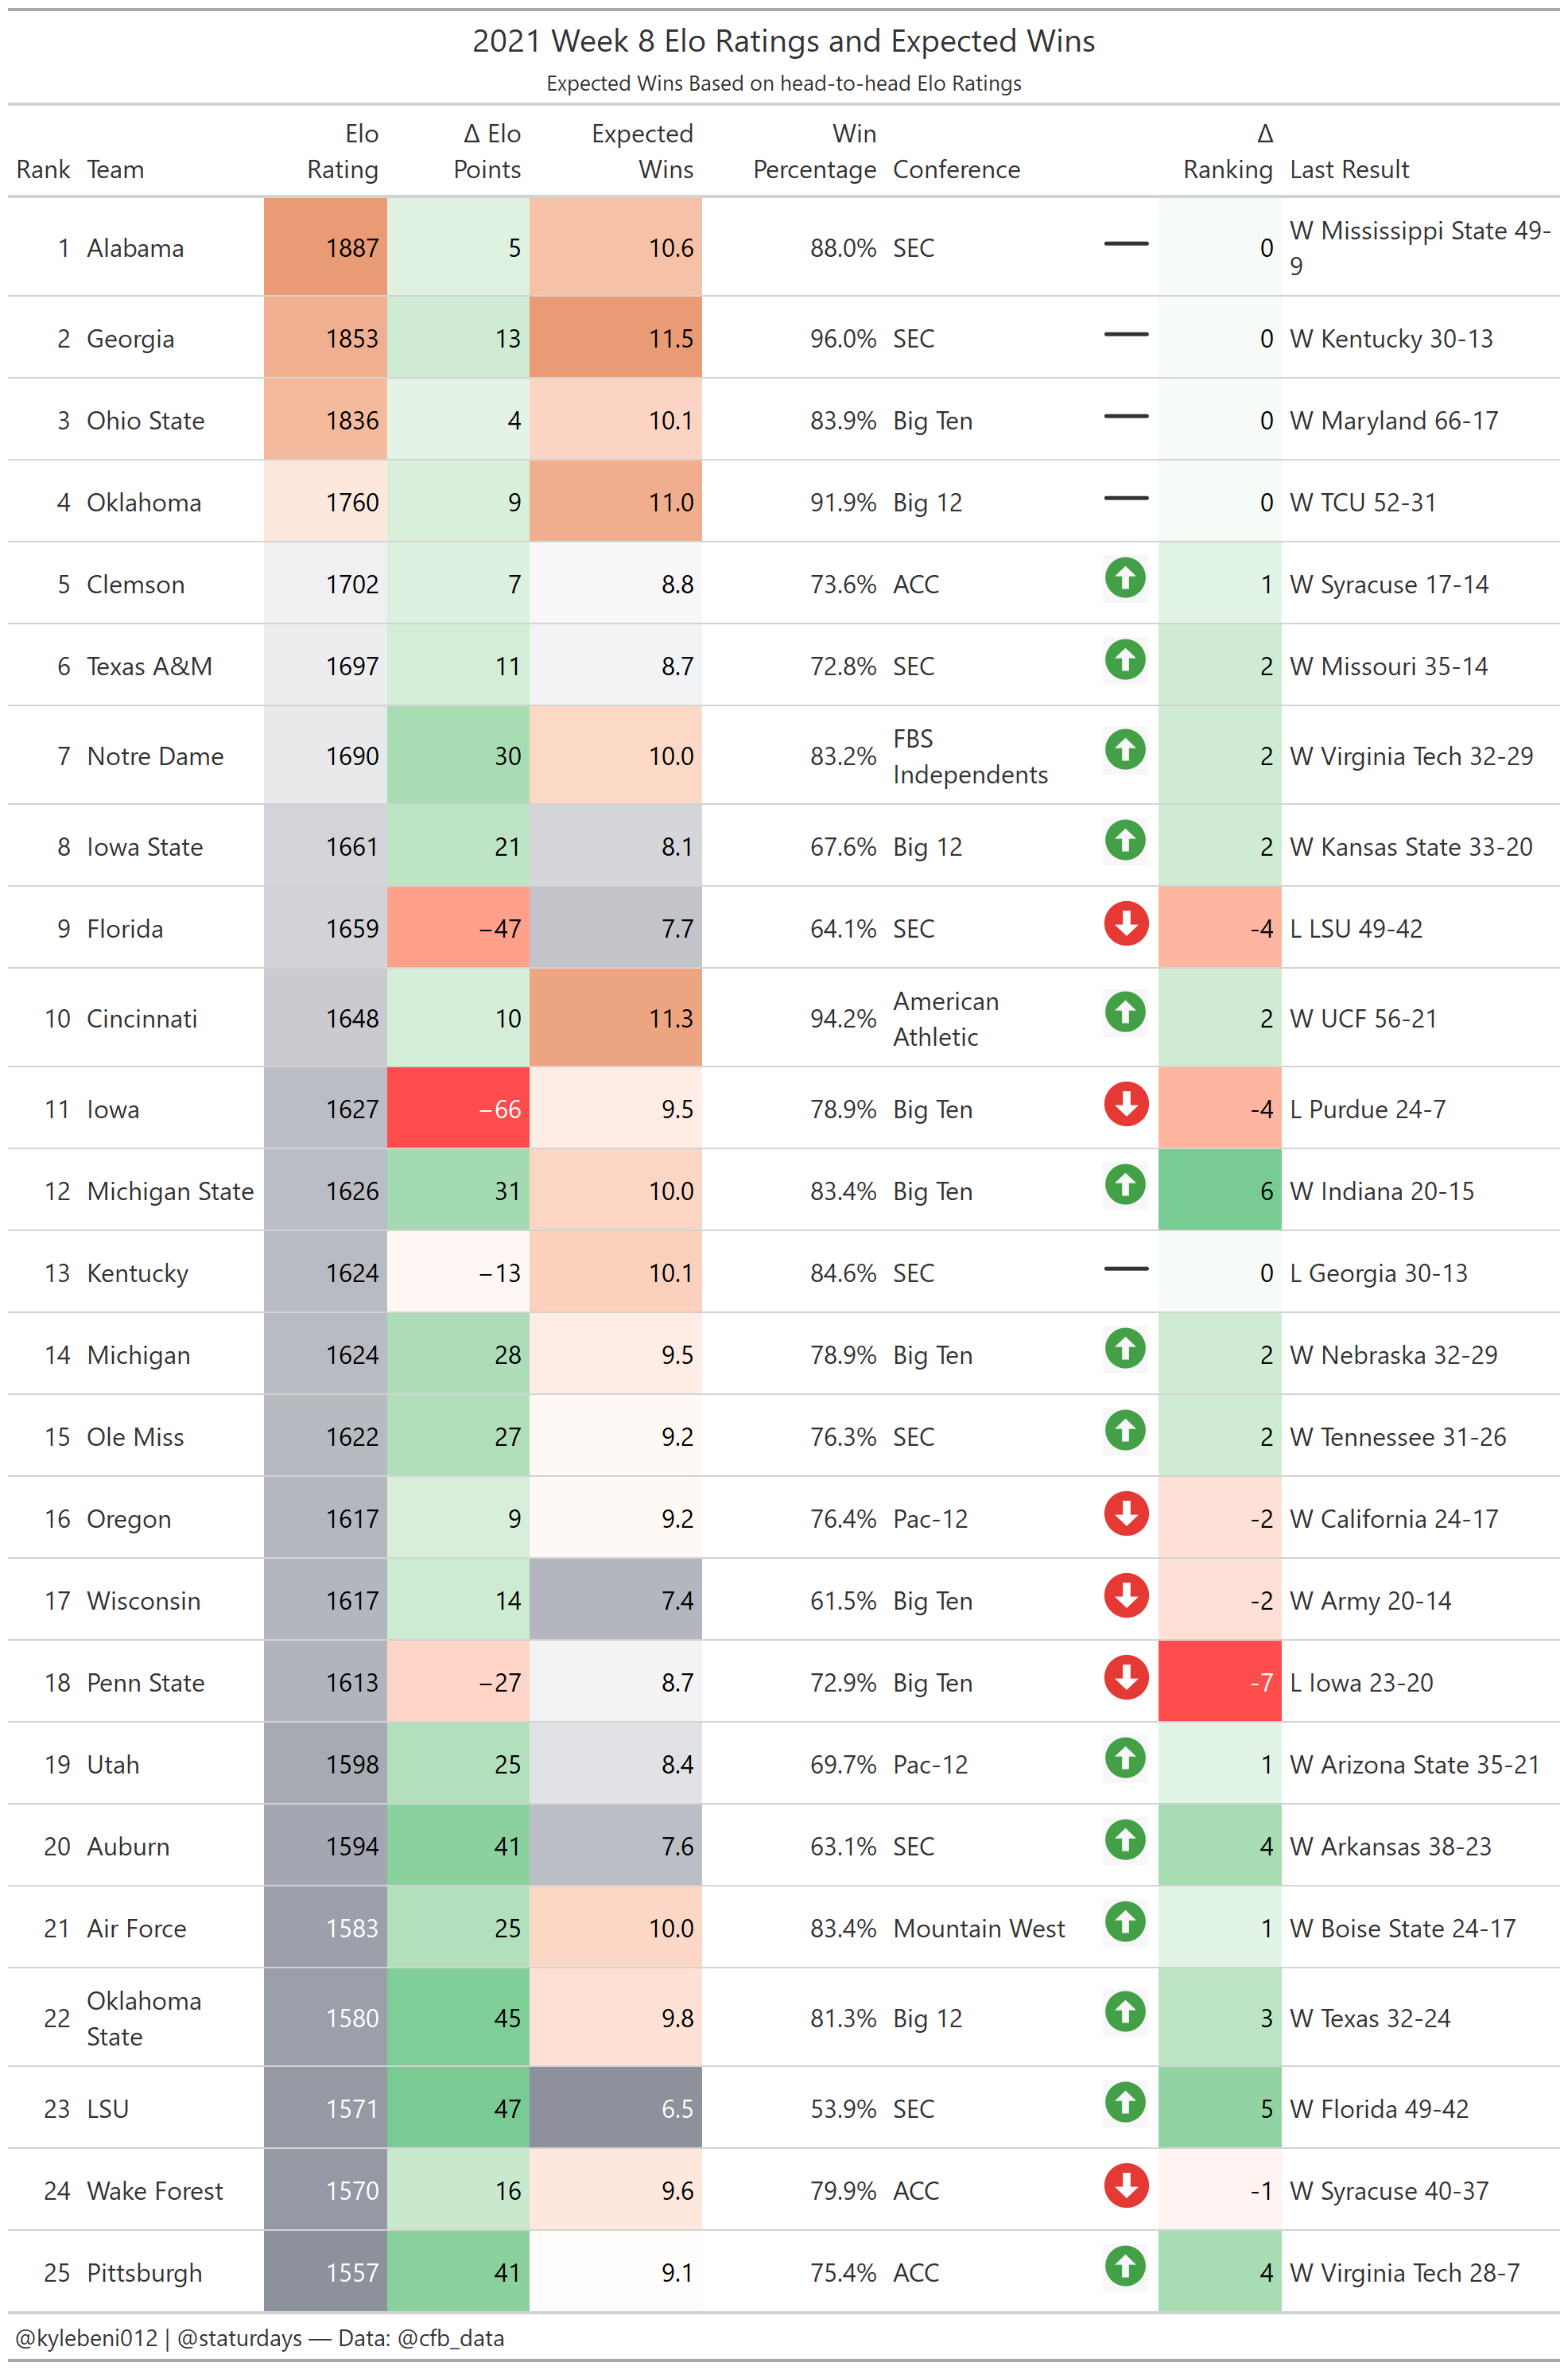
There are some big differences here. First, the number one team according to Elo is still Alabama. The AP Poll puts three teams above them in Georgia, Cincinnati, and Oklahoma (which, as I’m typing it out loud, sounds ridiculous… Oklahoma, with their QB situation, is ranked higher than Alabama, who prove year-in year-out that their backup is usually just as, if not more capable of winning championships.) (Elo already had Texas A&M rated as a top 15 team before they beat Alabama, by the way, while the AP had them unranked.)
Anyway, another glaring difference is Clemson still being a top-5 team according to Elo while being completely unranked in the AP Poll. So it begs the question: is Elo too slow to react to the realities of the current season? Does the AP Poll overreact? Let’s take a look and find out.
Comparing Elo Rankings to AP Poll Rankings
To find out which rankings are more accurate, I created an “Elo Top 25” each week from the year 2000 to present. Then, I used the ranking of the home and away team’s to predict the result of each game. I did the same for all the AP Top 25 matchups. Then, I compared the models.
Stats Talk
For those that are interested, I did a logistic regression on the home team’s outcome (win or loss) using either the home and away Elo rankings (1-25) or the home and away AP rankings (1-25). I only considered Top 25 matchups since the AP Poll doesn’t rank all 130 teams like Elo does. Then, I compared the models to see which one performed best.
I also threw in two extra models that used the following stats
Model 1: Home Elo Rating and Away Elo Rating
Model 2: Home Elo Predicted Win Probability (including home-field advantage)
Okay, we got that part out of the way. Let’s see what we found.
Results
Okay, so a good way to measure the performance of a model that is predicting a binary variable (two outcomes, e.g. Yes or No, 1 or 0) is the Brier score. What that is is the average of the squared difference between the actual result and predicted win probability for each game. So for instance, if the home team wins, the actual result is a 1. If their predicted win probability was a .9, then the difference is .1, and the squared difference is .01. The average of those squared differences for all the games is the Brier score.
If you simply assigned every team a 50% win probability, then your squared difference would be .25. So any Brier under .25 is better than guessing randomly, and anything higher than that would mean that your model is actually working opposite of reality, meaning when a home team should be favored to win, your model is predicting them to lose. So here are the Brier scores from our four models.
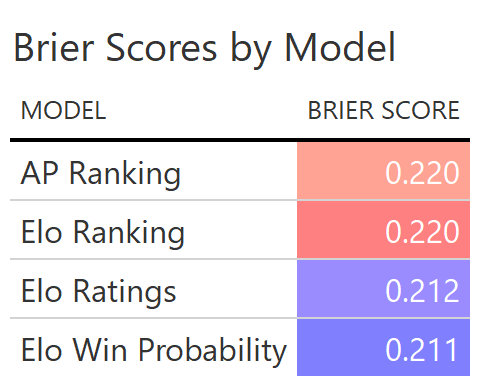
So, despite their wildly different rankings at times, Elo and AP Poll rankings perform exactly the same when picking Top 25 matchups. No wonder there are so many upsets in college football—the rankings aren’t that good to begin with!
The actual Elo ratings and Elo win probabilities perform a little better but still aren’t amazing. For reference, the overall Elo Brier score is around .175, so, unsurprisingly, it’s tougher to predict Top 25 matchups than some of the more one-sided games.
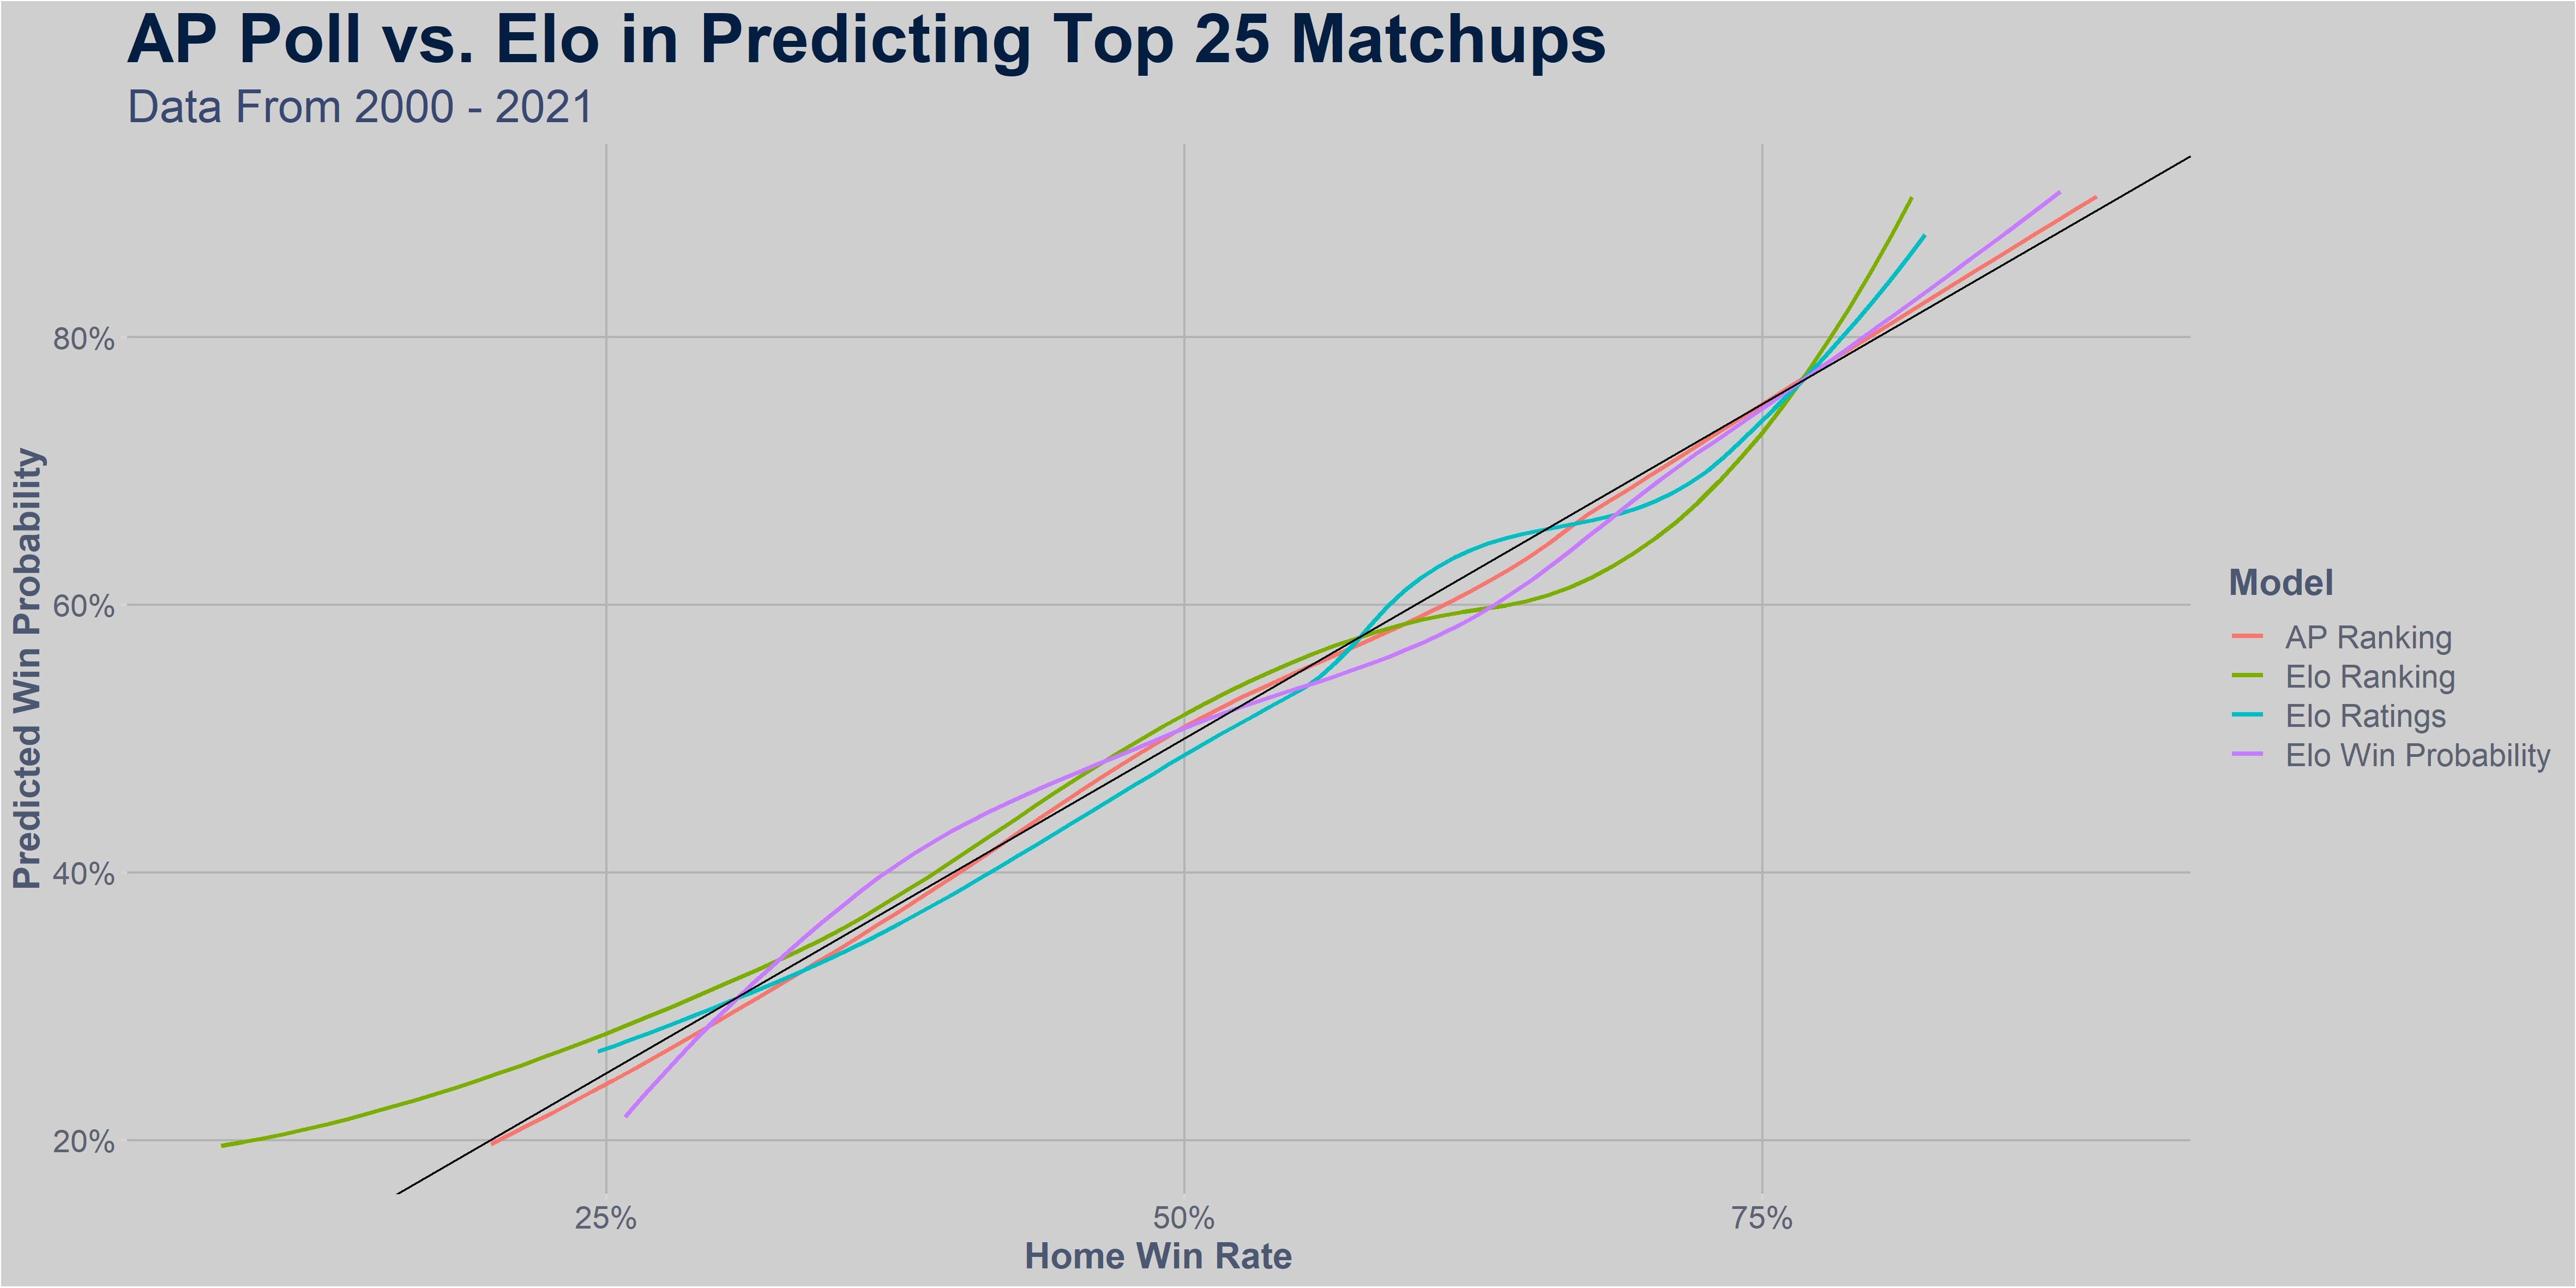
Below is a graph of the different models, with their predicted win probabilities rounded to the nearest 10%, and the average actual home result of those games. As you can see, all the models look fairly similar in this case, kind of dancing around the black line which is where the perfect model would reside, meaning teams that you gave a 50% win probability to actually won exactly half the time.
The Harsh Reality
So, whether it’s the AP Top 25 or Elo Top 25, the truth is it’s hard to just rank teams in order and confidently say that one will beat the other. More info is needed, like how much better the #1 ranked team is than the #2 ranked team, who has the home-field advantage, and whatever other data you can include that’s useful. And regardless of the data you use, predicting the outcomes of two great teams is always going to be more difficult than predicting the outcomes of great teams against mediocre teams.
But just because it’s the most popular poll, doesn’t mean it’s the best judgement of teams.

Leave a comment