Entering the 4th round of the U.S. Open, each of the matches in the bottom half of the draw feature an American man. And there were three more chances yesterday for the top half of the draw to add another three Americans to the 4th round, for a total of seven Americans (two lost at the time of publishing, and the third—Tien—is trailing 2 sets to 1). But of these Americans, which is best poised to get across the finish line?
“They are some of the biggest, strongest servers in the game, but struggle in the return game.”
The Americans by seed are:
(8) Ben Shelton
(9) Taylor Fritz [Out]
(11) Frances Tiafoe
(14) Learner Tien
(16) Brandon Nakashima [Out]
(20) Tommy Paul
So let’s take a look at their performance and stats and make an inference.
Recent Performance
Of the seeded Americans, Tiafoe is the most recent to play in an ATP 1000 final, where he lost to Arthur Fils (who then exited the U.S. Open in Round 1 to Stefanos Tsitsipas). That match was a three-setter which Tiafoe lost 6-0 in the third set due to poor serving and great returning by Fils.
Just prior to that, Ben Shelton beat fellow American Brandon Nakashima in two sets to win in Montreal. While Nakashima would make it to the semifinals in that tournament, Shelton was out in his first match in the round of 64.
The previous 1000-level tournament was on Clay in May, so I’ll stop there. The most recent 500-level tournament was D.C. in July, which Taylor Fritz won in two sets against the 19-year-old Rafael Jodar.
Season Stats
Serving
While Ben Shelton is the undisputed biggest American server on tour with a first serve that can eclipse 145 mph, Taylor Fritz—with five years experience and an extra inch of height—has a slight edge when it comes to first serve points won and aces. Shelton has the edge on second serve points won and overall service game win rate, indicating that perhaps Shelton is a bit better than Fritz in a longer rally, although I couldn’t find data on this.
Although, according to ATP’s “shot quality” metric (which is a bit of a black box but is described by them below), Fritz has a top-20 forehand and backhand on tour, while Shelton sits at 61 and 38 in those categories.
Shot Quality – measures the quality of the player’s serve, return, forehand and backhand on a 0–10 scale. Shot Quality is calculated in real-time by analysing each shot’s speed, spin, depth, width, and the impact it has on the opponent. Tour averages: Serve 7.9, Return 6.5, Forehand 7.5, Backhand 7.1.
– ATP Tour
Returning
Learner Tien is the best American returner on tour this year, winning 31.4% of first serve return points (Alcaraz is best at 34% and Sinner is fifth at 33%). Tommy Paul is 14th.

I had to skip down the list past several other Americans who aren’t in the U.S. Open to find Tiafoe’s first serve return rate (58th, 26.4%), Nakashima (64th, 25.9%), and finally Fritz (73rd, 25.3%), and Shelton (79th, 24.4%).
On second serve, the story is mostly the same for Shelton (70th) and a bit better for Fritz (30th), but therein lies the problem with the top American men at the moment: They are some of the biggest, strongest servers in the game, but struggle in the return game. So while they tend to hold serve, they struggle to find breaks themselves, especially when they face similarly good servers or highly competent returners. And winning by tiebreak only gets you so far.
(At the time of writing this, Taylor Fritz lost to Francisco Cerundolo—the sixth-best returner according to ATP—in five sets.)
Tien is the only American in the top 15 on both first and second return.
Tommy Paul is the only American in the top 25 in both serving and returning.
Below, what I tried to do is account for the in-rate on the 1st serve to downwardly adjust the 1st-serve win-rates. In essence, having a 90% 1st serve win-rate is great, but if you only get your first serve in 10% of the time, you should be severely penalized for that (so that your adjusted 1st-serve win rate would be 9%).
Then, I summed all four numbers (with 1st-serve win rate multiplied by in rate first), because you want all four of these numbers to be high, and re-ranked the Americans.

Looking at things this way, we can see that Tommy Paul is the most balanced player, performing adequately well on service games and above-average in returning. This jives with the finding above that he is the only American man ranked top 25 in both.
Tien is an excellent returner but is held back by his weak serve win-rate compared to the rest.
Tiafoe is held back by his first-serve in rate.
Four- and Five-Set Performance
The other key difference in majors is that it is best of five. So how do the top Americans fare when they need to go beyond the typical three-setter?
I couldn’t get all historical data, so I pulled data for the past year manually, and while the sample size is small, we can see that Nakashima has struggled when going beyond three sets this year, while Fritz and Shelton have fared well in four but struggled in five. They, along with Tien, have the most experience in longer matches this year.

Of course, there’s some inherent bias in this data. The three-setters that these men won (or lost) are not represented, so these are only the matches where there was inherently some competition. This is also not controlled for tournament round or strength of opponent.
Both of Nakashima’s losses came in rounds one or two. Shelton’s was his shocking first-round exit at Wimbledon. All the rest were scattered between rounds two and five.
What Does Elo Say?
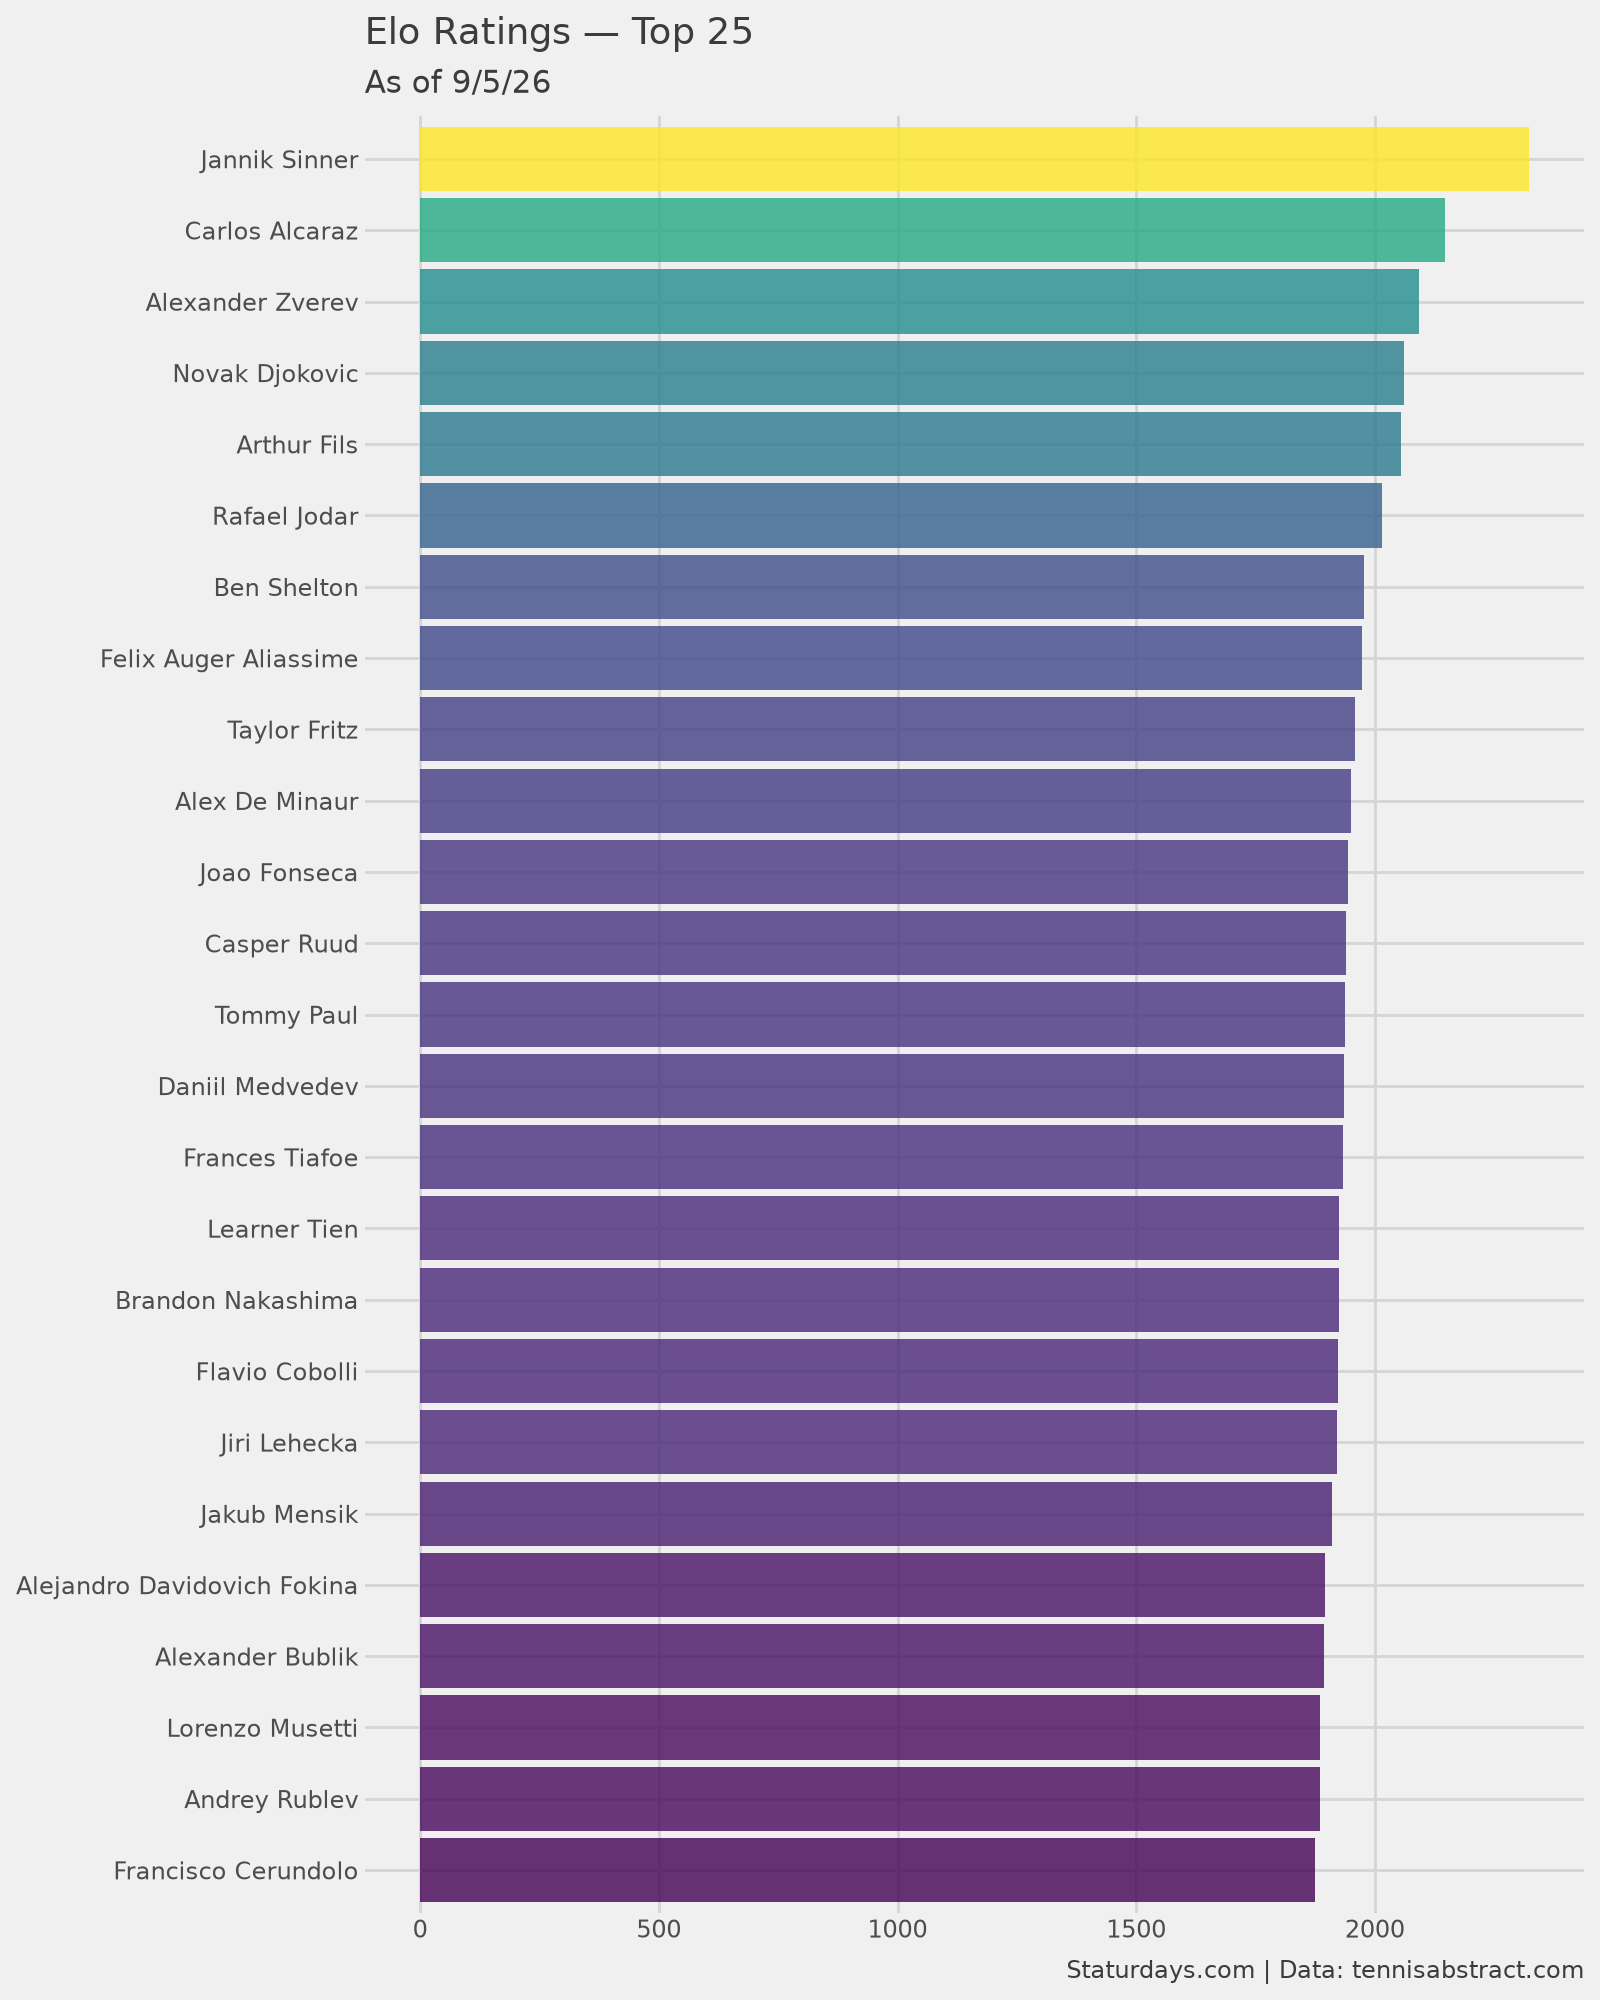
I took a look at the Elo Ratings from Jeff Sackmann’s Tennis Abstract and this is where they are at currently (for a primer on Elo ratings, our explainer for our College Football Elo ratings is a pretty good intro and the general concept applies here as well. Jeff Sackmann has his own explainer on his Tennis elo too.):

As you can see, Shelton leads the American men in seventh, but Fritz, Paul, Tiafoe, Tien, and Nakashima are all clustered just behind him in the top 20.
Conclusion
Each American man has gaps in his game which hold him back from achieving the pinnacle of winning a Grand Slam. Tommy Paul appears to be the most balanced of the bunch, performing above-average in serving and returning, while the big servers of Fritz and Shelton are top-class at serving and bottom-class at returning. We are only talking about a few percentage points difference, but those are the margins that matter in a best-of-five set match.
Given that Paul is 29, his window for bringing his game to that peak level is closing. While it’s not unheard to win your first major at 29 (Zverev just did it this year) or even older, the list of first-time winners over 29 is small (seven, to be precise).
Fritz is 28, and while he’s ranked higher in Elo and the more well-known player, he has arguably a steeper hill to climb than Paul with his returning woes.
Ben Shelton is only 23, so he has time on his side. If he can focus on his return game over the next few years, then he likely has the best shot at winning a slam of the bunch.
Tien, at only 20, might have an even better road to a slam than Shelton. He is an elite returner already, so if he can dial in his serve over the next few years, that will become a lethal combination. The only thing holding Tien’s serve back may be his 5’11” frame. (I will look at the relationship between height, serving, and winning in a future article.)
Is it harder to improve on your serve or your return? I’m not sure, but I’d lean towards it being easier to improve your serve since it’s more down to biomechanics, while returning is all about reading body language, reaction times, flexibility, and intuition. That feels much harder to train and get good at if it doesn’t come naturally.