
As a Penn Stater (and yes, an Eagles fan) it makes me very happy to see Saquon Barkley getting a chance at a Super Bowl ring after suffering with the Giants for a few seasons. From the initial reaction I saw, not everyone was pleased with a Chiefs/Eagles game again. I had a small preference for the Bills over the Chiefs, but now they get a chance to beat the best. Even though this is a rematch of the Super Bowl two years ago, there are still a number of things that have changed since the last time these two played. To prepare for the game I spent some time playing with the publicly available play by play data to see what interesting things we can find out about this matchup.
Using data from the nfldatapy Python library, I primarily focused on the quarterback matchup we will see this week. To start, I was curious how the play calling distribution has changed since the last time these two teams played in the Super Bowl. Since that time, the Eagles have acquired Barkley (and lost Miles Sanders) and have a new offensive coordinator in Kellen Moore. For the Chiefs, Kareem Hunt is now the most used running back (Pacheco led the team in rushing attempts in 2022) and they have a new offensive coordinator since the last Eagles/Chiefs Super Bowl — but Matt Nagy has been around for a few years now in that role with the Chiefs, so it’s not his first season (or Super Bowl) with the Chiefs.
In 2022, the Eagles averaged 31 pass attempts/game and 32 rushes/game per pro-football-reference. In 2024, that has shifted to 26 pass attempts/game and 36 rushes/game. (For this article I used all games to keep things simple, but acknowledge that Hurts only played in 15 games missing a few with an injury, and Mahomes also sat out the last game of the regular season.) The Chiefs were closer to their 2022 distribution this season, averaging 38 pass attempts/game in 2022 (vs. 35 pass attempts/game this season) and 24 rushes/game (vs. 26 rushes/game).
Adding Barkley only increased the rush attempts/game by +4. But those extra 4 rushes/game (a 12.5% increase over 2022) resulted in a 21% increase in total rushing yards in 17 games (with 2022 including the Super Bowl in those stats). The Eagles’ success rate on rushing plays (defined as gaining at least 40% of the yards required on first down, 60% on second down, and 100% on third and fourth downs) decreased from 56.3% in 2022 to 47.7% in 2024. Of course, rushing stats are going to be a combination of play calling, running back performance, and offensive line performance, so there are a few factors at play here with these evaluations. I was surprised to see the success rate lower with Barkley than with the 2022 Eagles, but some of this could be related to the attention Barkley attracts. His explosiveness might cause defenses to try to stop the run more, making the average play less successful but still having a rushing attack that produces more yards overall due to enough big plays — Barkley has had 21 runs that went 20+ yards this season (5.1% of his attempts) vs. 9 runs for Sanders of that length in 2022 (3.0%).
Looking at the passing matchup, Hurts is averaging 6.1 air yards per completed pass vs. 4.5 for Mahomes. (A quick search for Air Yards rankings reveals various numbers for season long averages — my method here is using nfldatapy to remove two point conversion attempts and sacks when calculating averages and otherwise trusting their air yards column.) On incomplete passes Hurts is averaging 11.0 air yards/attempt vs. 10.5 air yards/attempt for Mahomes. Not surprisingly, average attempted air yards is higher for incomplete passes than completed passes, but I was surprised Hurts had a higher average air yards in both categories (I don’t watch all Chiefs games, so this is just based on what I have seen).
The next item I looked at were the favorite targets of both players. The following table shows the top five most targeted players by each quarterback, with the percentage of targets shown:
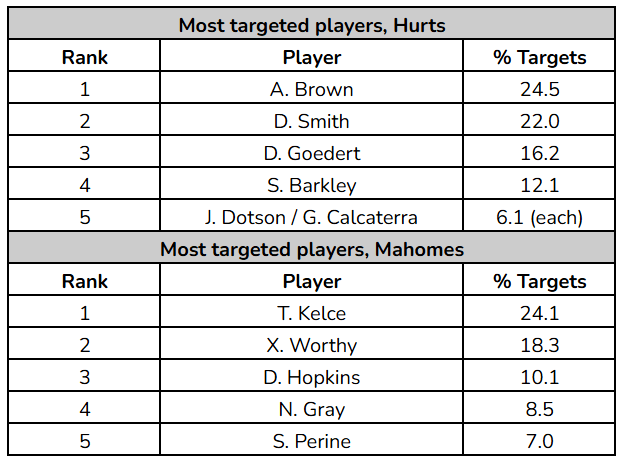
Brown and Smith lead the way for the Eagles with 24.5% and 22.0% of targets, respectively. For the Chiefs, Kelce is the most targeted (24.1% of targets) followed by Worthy at 18.3%. The top five targets for Hurts account for 80.8% of all targets, while the top five for Mahomes only account for 67.9% of targets. Although I didn’t look into it for this article, comparing the distribution of pass targets to team success or other metrics would be interesting to see if there are any trends there (does a more even distribution of who you throw the ball to really impact any metrics?).
What I really wanted to create was a map of targeted locations on the field for each quarterback (like I did for a Penn State/Iowa game in 2020), but that data is not publicly available to download yourself for NFL and I certainly didn’t chart every game, though you can play with these on the Next Gen Stats website.
That said, nfldatapy does provide information on pass location broken out by left/middle/right side of the field. We can then combine this with air yards to get an idea of where players are passing the ball most, even if the exact location is not known. First I looked at the distribution of throws to side of field (left/middle/right) by complete vs. incomplete passes. The following table shows the distribution of passes that were thrown to each part of the field by quarterback separated by compete vs. incomplete attempts.
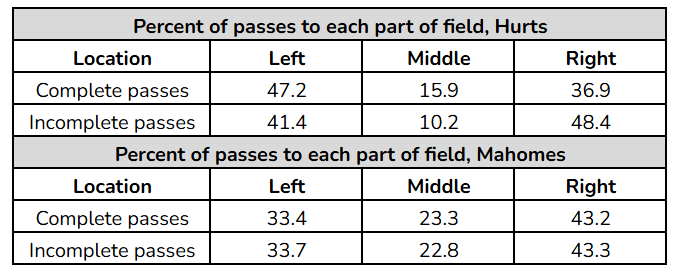
The first thing that stuck out to me was the consistency of Mahomes in the distribution of throws to each side of the field when comparing complete vs. incomplete passes. All three distributions were within 0.5% of one another when comparing the completed pass sample to the incomplete pass sample. This is in contrast to Hurts, where 36.9% of his completed passes are to the right side of the field but 48.4% of his incomplete passes are to the right side of the field. Put another way, knowing whether a pass was completed or not would not be a helpful predictor in determining which side of the field Mahomes threw the ball to, but it would be helpful for predicting which side of the field Hurst threw it to. If it was a complete pass, we would guess it was most likely he threw to the left side of the the field.
Combining our air yards and the field location data we do have access to, we can start to build a picture of where each quarterback throws the ball (regardless of whether the pass was completed or not). The following tables show the distribution of pass targets by air yards and location of the field:

Nearly one out of every four pass attempts by Mahomes has negative air yards (23.2% of targets) vs. 14.5% for Hurts. The majority of both players pass attempts are in the 0-9 air yards category with 55.9% of Hurts passes falling in that category and 50.3% for Mahomes. Hurts had a slight preference for the left side of the field in that category (26.3% of all throws) and Mahomes to the right (21.3% of all throws). I would guess that a lot of the differences in side of field are down to scheme and where favorite targets line up/have routes going, but the data I am using does not have route information so it’s not easy to confirm that. Using FTN Data via nflverse we can find out that 13.6% of non-sack pass plays were screen plays for Mahomes vs. 8.3% for Hurts, which explains some of the negative air yard trend.
The final analysis I did was looking at completion percentage vs. air yards of a pass attempt. Simply, does either quarterback have a higher completion percentage when throwing the ball a certain number of air yards? To answer this, I fit a simple regression model with air yards as the predictor and whether a pass was completed or not as the outcome variable. I chose a cubic model to capture some changes in accuracy by distance while offering up the ability to have more than one inflection point, if accuracy had a second shift at any point. (This is admittedly a simple model. Another option would be to group air yards into buckets and just report the average completion percentage, but I wanted a model that could show the probability of a completed pass for any individual attempt and the general trend.)
The following chart shows the probability of a completed pass (y-axis) vs. air yards (x-axis). The model trend line is plotted and individual pass attempts are shown as points.
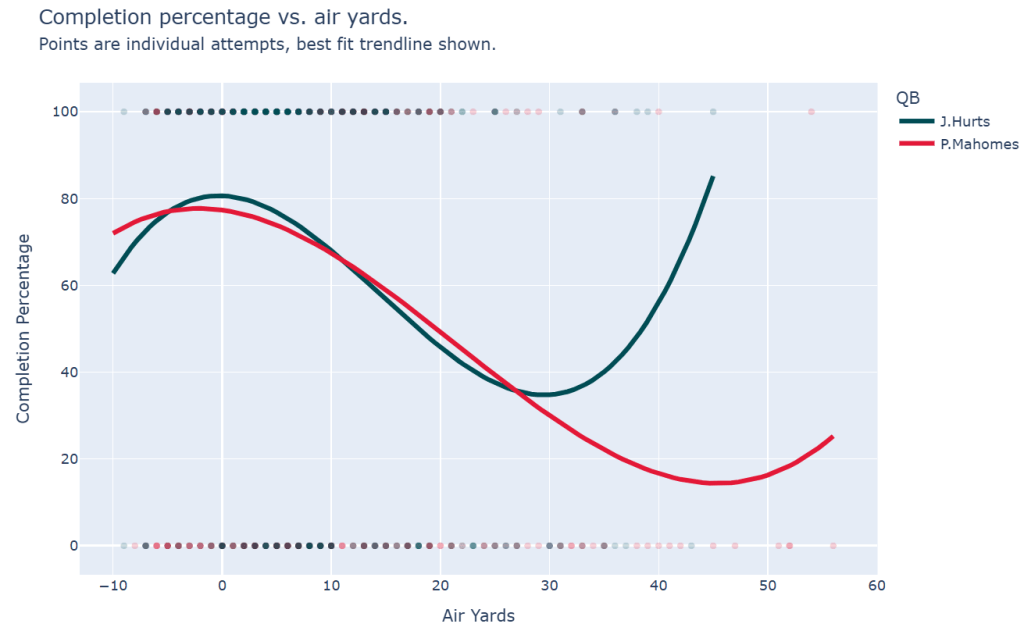
Two items stood out to me. First, the trend lines track very closely from 0-25 air yards. Hurts has a slightly better predicted completion percentage in the 0-10 range and then Mahomes is slightly above in the 10-25 range, but they are relatively close. The second thing that jumps out is the divergence at around 25 air yards. After 30 air yards, Hurts completes around 43% of his passes and Mahomes completes around 20%. So why does the Hurts trend line jump up to 85% predicted completion percentage at 45 air yards? The primary reason (and the reason we wouldn’t want to use this model as is for predictions into the future) is that Hurts has far less pass attempts at that range and we are over fitting to the little data that is there.
Although the previous table showed that both quarterbacks threw around 4% of their passes 30+ air yards, Mahomes has more pass attempts this season overall. Hurts has 16 passes of 30+ air yards to Mahomes’ 25, and once we filter for just 40+ air yard passes, we get just two samples for Hurts and 11 for Mahomes. Hurts completed 1/2 of 40+ air yard passes, while Mahomes completed only 22%. Some of this could come down to when each quarterback decides to throw the ball deep as well. If Hurts is more choosy in when he throws downfield, he might convert at a higher rate, but I wouldn’t expect that completion percentage to be 85% on balls thrown 45 yards in the air once we got a significant number of samples. So while we wouldn’t have a ton of confidence in this model to predict future completion percentages due to the small sample size, it does reveal some interesting trends about observed completion percentage this season. If/when Hurts does throw it deep, we might expect those situations to occur when receivers are more clearly open. If the splits of pass/run play choice from the regular season continue, we would expect Mahomes and Hurts to have an equal percentage of their passes down field, but Mahomes would have more overall chances, and we’d expect a lower completion percentage on those balls for him than Hurts based on our simple model.
While this is really just the surface of things we could look into ahead of the game, I think the quarterback comparison is always interesting, particularly with run/pass tendencies and targets. Even though these two teams played just a few seasons ago in the Super Bowl, with the Eagles shifting more towards a run dominant team, the offensive matchup will look a bit different this time.
