Noah Cain

  • Another Look at the Penn State RB Position: Success Rate, Yards Gained Distribution, and Standard Deviation

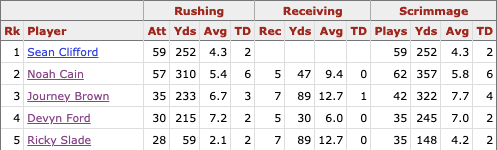
    With Noah Cain out the last two weeks, we’ve seen a lot more of Journey Brown in the run game as the official RB1 — he’s handled nearly 50% of the workload in the past two games. It’s been exciting at times, given Brown’s big-play ability in both the run and the pass game. However, he’s always felt like a boom-or-bust back to me. I wanted to see what the data showed and see if my impression was true.

    While Brown has been leading the RB committee most of the season in yards per attempt both on the ground and in the air, the fan consensus has been for Noah Cain to be RB1. I have been wondering why this has been the case, given that both Brown and Devyn Ford have better YPA than him. The only conclusion I could draw, given the eye-test and feedback from loyal PSU fans, is that Cain is the more “reliable” back. Some people call this “success rate”: the percentage of plays that are deemed “successful”.

    In essence, this looks like:

    • gaining 5 yards on 1st and 10
    • 70% of the yardage to go on 2nd down
    • all the remaining yards to go on 3rd or 4th down.

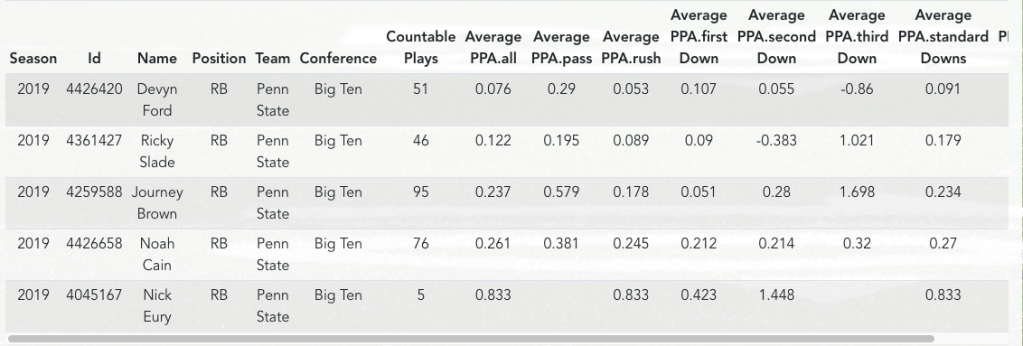
    Success rate is factored into PPA (Predicted Points Added), the cousin of EPA. At a glance, justifying the majority opinion is the fact that Noah Cain leads the RB committee in PPA (Data is courtesy of CollegeFootballData.com, and you can see this data for yourself here).

    Noah Cain leads all PSU RBs with .261 average predicted points added in the 2019 season.

    I decided to look at it in two additional ways: the distribution of yards gained on each run, and the standard deviation of run plays. Let’s take a look at the graph first.

    Distribution of yards gained on run-plays only, for the Penn State rushers.

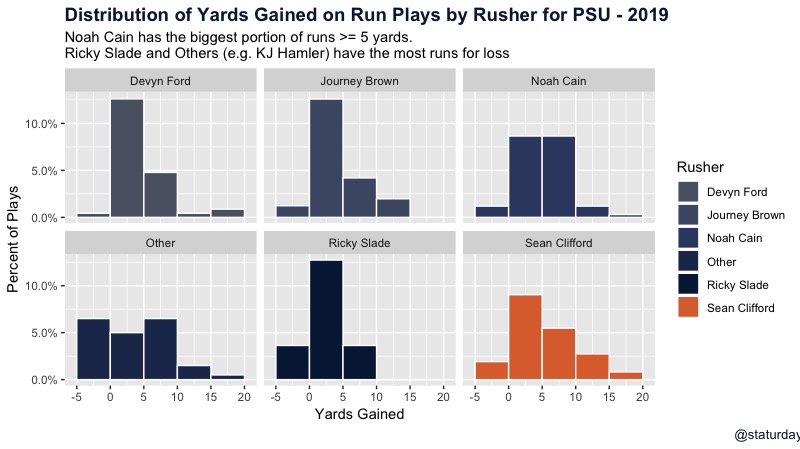
    This graph shows us how many yards each runner gains, bucketed into groups of 5 yards. I limited the graph to 20 yards so we can compare everyone easily, but this doesn’t do Brown justice in terms of just how explosive he can be. Even from this graph, we can see that he has a higher percentage of rushes of 10+ yards than any of the other feature backs. What the graph doesn’t show is that he also has five runs of greater than 20 yards, the most of any RB. Noah Cain has the fewest.

    With all that being said, we can quickly see that Noah Cain (top right) is the most consistent in short-yardage situations, which is why so many fans love him. Quite simply, he gets first downs. Cain has the largest proportion of his runs that go for 5-10 yards. He doesn’t get many gains of larger than that, but he also doesn’t lose yards too often. While more explosive, both Brown, Ford, and Slade have a considerably larger portion of their runs going for less than 5 yards.

    Finally, let’s look at the standard deviations of these backs’ yards per play. This will give us an idea of how much variation there is in their yards per attempt. For a simple example, if a running back ran for 5 yards every time, his mean would be 5 and standard deviation would be 0. If a running back averaged 5 yards per attempt, but only ran for either 10 yards or 0, his standard deviation would be 5, indicating more of a boom-or-bust style back (this is a rough estimate).

    Average yards per attempt (mean) and standard deviation of rushing attempts for Penn State rushers.

    So from this very exciting chart, a smaller standard deviation implies a more consistent back with less variation in each individual run play. Cain’s is considerably lower, at 4.7 yards, than the rest of the top backs. Ford and Brown, unsurprisingly, lead the way in terms of variability in their run plays. This chart further validates what the histogram above was hinting at.

    While Brown (and Ford) are certainly the undisputed backs with big-play ability, when you need a first down and a reliable few yards, Noah Cain still appears to be the guy. His status for Saturday is still up in the air, but Lord knows we’re going to need plenty of both to have a shot at the upset against #2 Ohio State.

  • Should Noah Cain be RB1?

    In the past few games, Noah Cain has proven himself to be a reliable and consistent weapon on offense. Penn State has famously been using a running back by committee philosophy for the first half of the season, and so far, it’s worked out fairly well. However, the backs are starting to separate themselves into tiers, and a tipping point is coming up.

    Here’s the stats for the committee (including Sean Clifford, who, through 6 games, is Penn State’s leading rusher with 59 attempts.

    Performance from Penn State’s top-5 rushers so far this year, through 6 games.

    As you can see, Noah Cain is starting to set himself apart in terms of his attempts and his TDs. Now, attempts are James Franklin’s decision, so he hasn’t influenced that stat line (but he has made the most of it by being consistent).

    TDs are another one where he is obviously putting the ball in the endzone, but he is also being given the opportunity more than other backs. He hasn’t been nearly as explosive as Journey Brown or Devyn Ford. His TD runs have been for 3, 9, 2, 13, 2, and 5 yards. So, I’d give more credit to our offensive line for carving a hole, rather than him making some explosive play to punch it in himself.

    In terms of Yards per Attempt, as mentioned, Brown and Ford are the leaders here. Each of them are hovering around 7 yards per attempt. Brown has also been a threat in the pass game, albeit on a minuscule 7 receptions. That being said, Cain’s YPA are nothing to (I can never remember how this saying goes) sniff? — at. He’s averaging 5.4 yards per attempt, or in other words, half a first down per attempt. I’ll take that any day, considering only 16 teams in D-I average more than that. As in whole teams, that get to switch out their backs and put in fresh ones.

    So now that we have an idea of where Noah Cain stands in the hierarchy of RBs (in my opinion – pretty even with the top 3), the question is what to do about the snap count for each guy.

    My dad, and noted Staturdays commenter, brought up an interesting point about the transfer portal, and if Franklin is scared of its implications in the first full season of use. Given that Penn State lost a lot of prolific talent to other programs in the offseason (mainly the drop-plagued wide receivers and defensive backs), that fear might still be lingering in his mind.

    His concern was that Franklin may be spreading the ball out more than the data suggests in order to keep all four guys content with their decision to attend The Pennsylvania State University. This could be the case, but there are two edges to that sword.

    1. Play all four backs evenly, and they all get playing time and are happy, but you may not get the optimal production in the run game.
    2. Play all four backs evenly, and the true “star” RB that deserves more snaps than he’s being given enters the transfer portal anyway, looking for a program that will give him his fair share of the workload (Noah Cain currently carries 24% of it at Penn State. Not that these two players are comparable yet, but for reference Jonathon Taylor receives 47% of the workload in terms of attempts.)

    Either way, it looks like the committee is a risky option once you have found your guy. Now, in the first half of the season, Franklin didn’t have much of a choice. These guys are young and Franklin needs to play them to figure out what they’ve got in a real game (Brown is a junior, Slade is a sophomore, and Ford and Cain are Freshmen).

    Unfortunately for us (and Franklin), Penn State’s data doesn’t really hint at whether a committee or a star RB is best. In the games where we have employed the most committee-style run-game, they have been blowouts against bad defenses. Everybody and their little brother got into the game, and regardless of who was toting the ball, they were carrying it well. So the data is skewed.

    Yards per Attempt for the team in games where Penn State RBs shared the ball, vs. when they used a star RB (30% or more of the workload).

    When a Penn State rusher got over 30% of the workload (which has only happened in 3 of 6 games), we actually rushed worse than when the ball was spread out, by more than 1 yard per attempt difference. That being said, the games where we rushed by committee were against Idaho, Maryland, and Purdue, all of which we beat up on.

    So for now, I am arguing for Franklin to continue what he’s doing and spread the ball out. The past few weeks have given all of us a favorable impression of Noah Cain, and rightly so, but let’s not ignore the impact that having four (or five, shoutout Sean Clifford) versatile running threats can have on the game.