Exploratory Data Visualizations of First Down Rate, Average Yards to Go, and Passing Rate by Down
Like most of you, I am finding myself realizing that there is not much to do when you can’t make “plans”, per se. I decided to try to use some of my time productively this past weekend by messing around with some college football data (courtesy of @CFB_Data). The results paint an interesting picture about individual teams (just how good LSU was in 2019; just how much Maryland struggled on 4th downs), as well as overall trends in college football playcalling.
So let’s just dive right into it. I won’t get into too much detail other than sharing my takeaways from some of these graphs. They’re not gamechanging, but they’re interesting to look at.
Looking at individual teams on 3rd and 4th downs
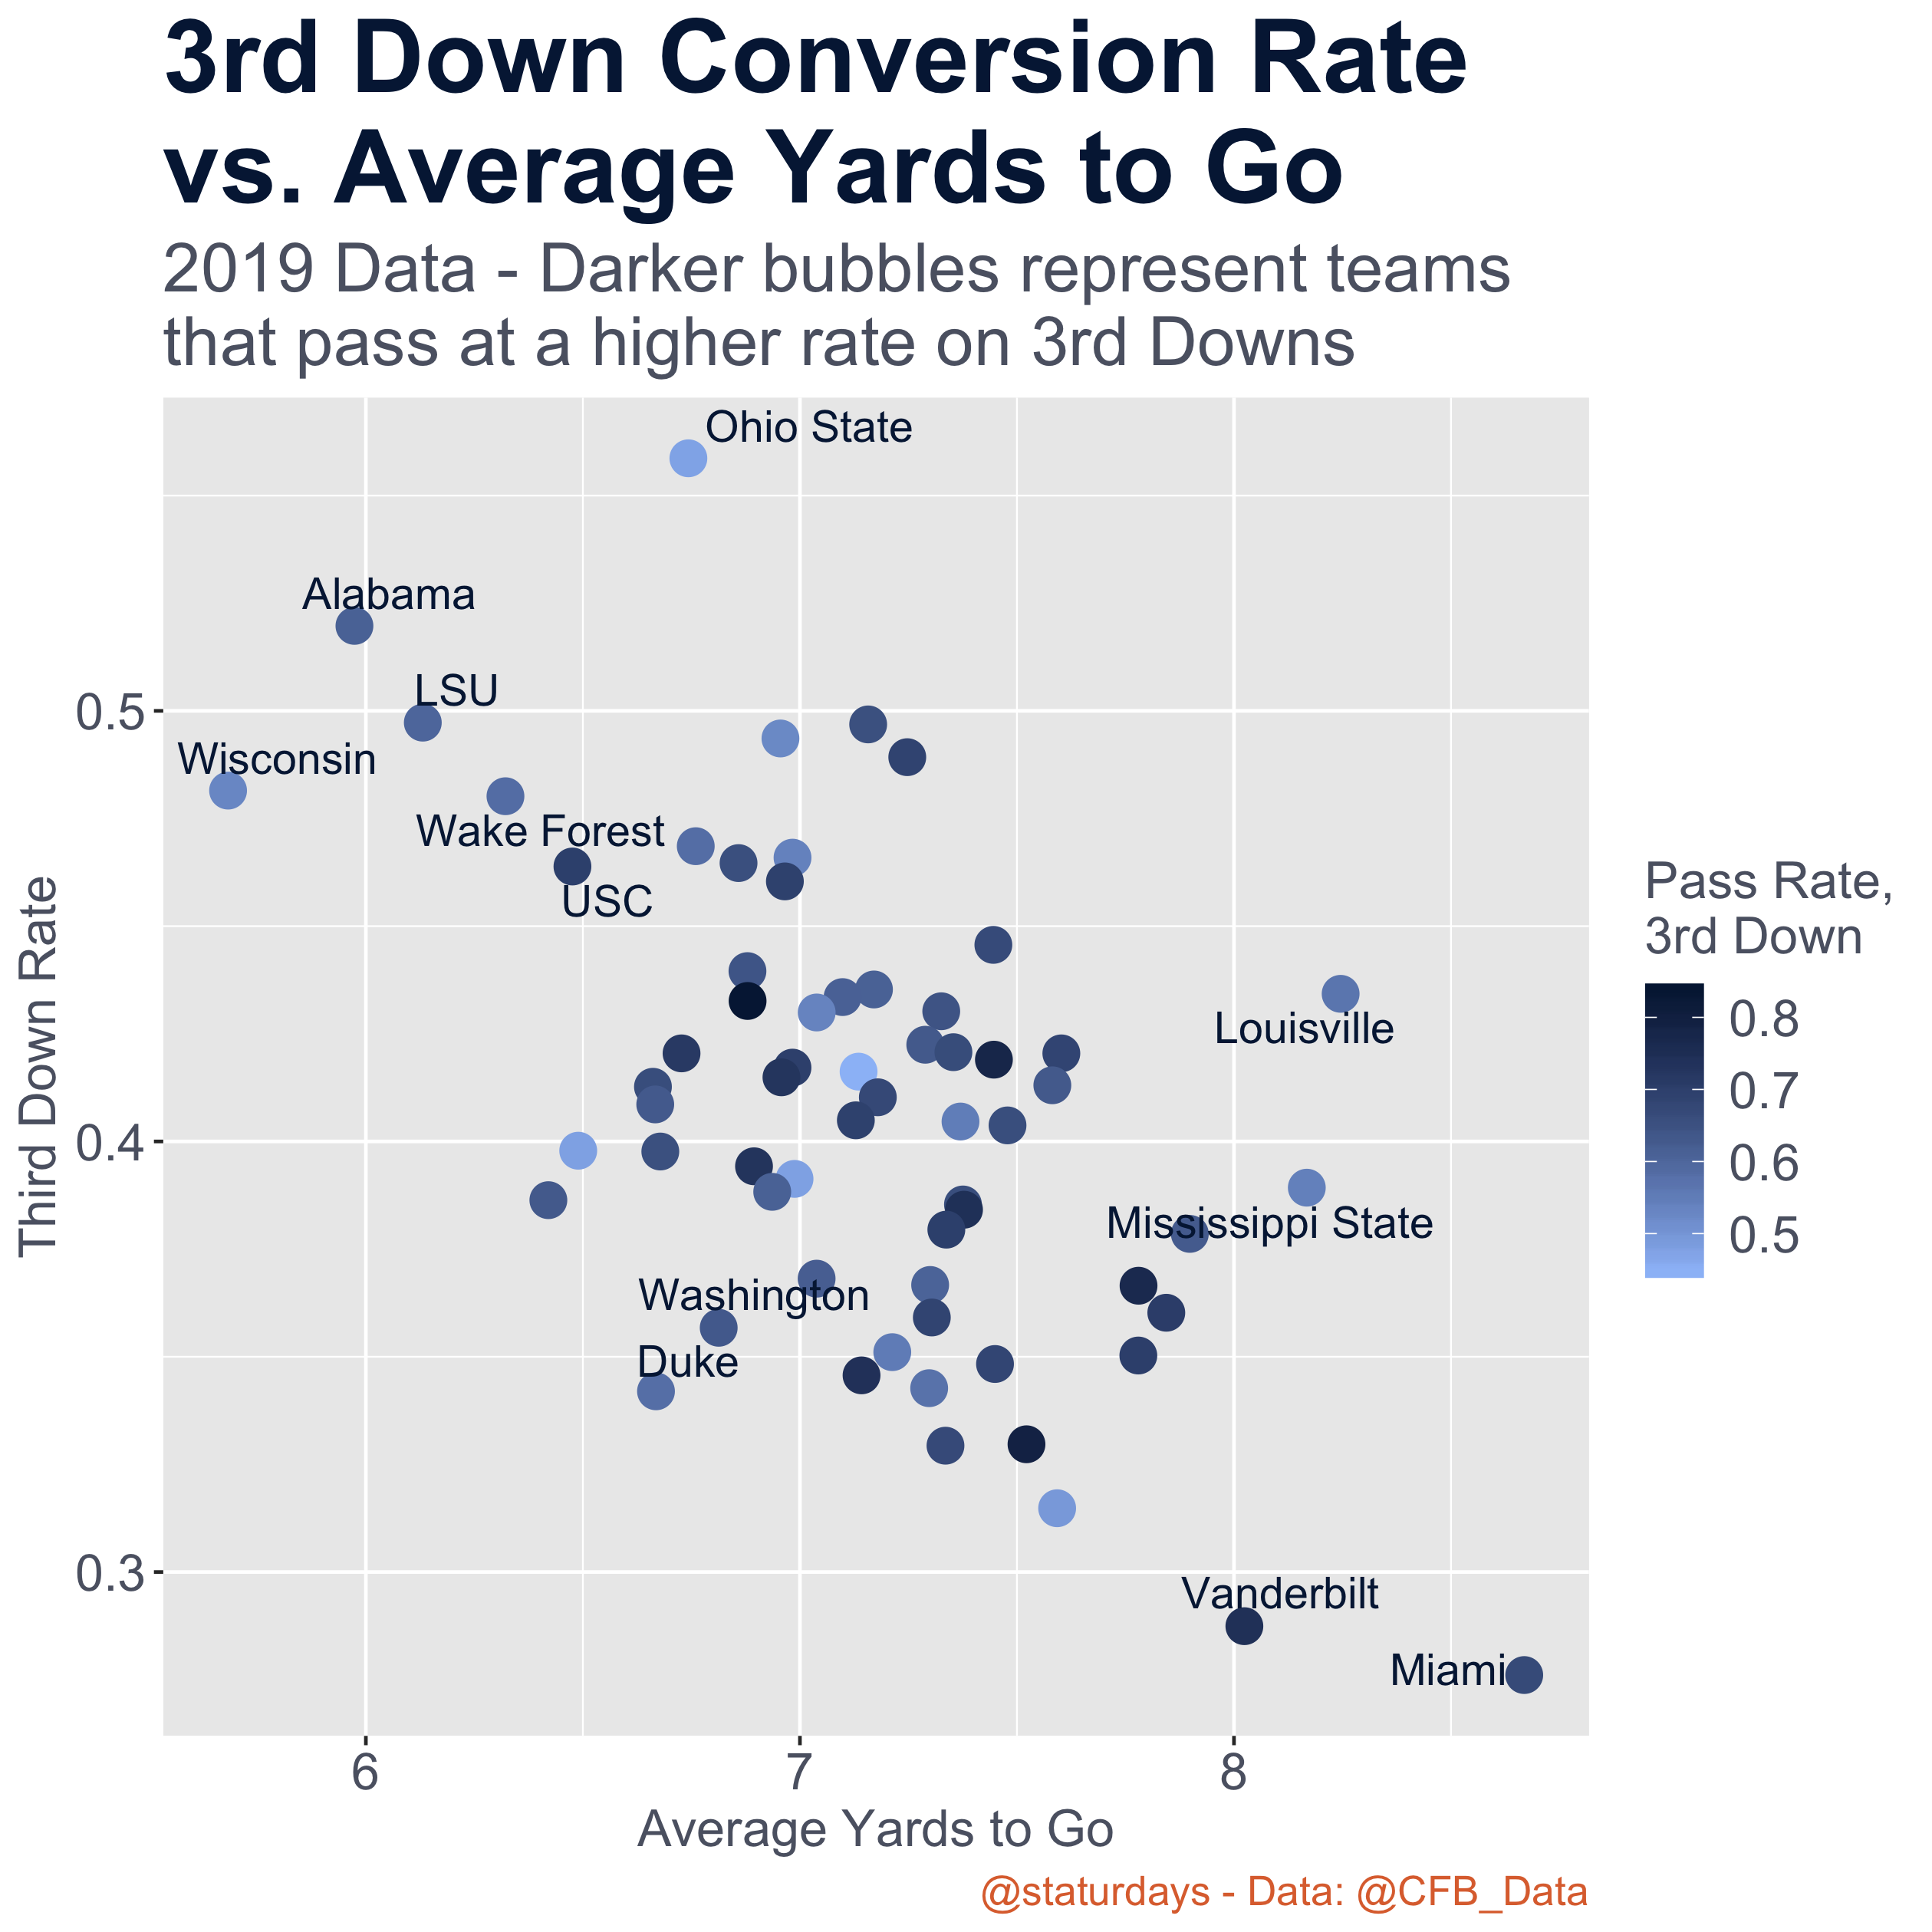
Intuitively, you see that the less yards teams have to-go on 3rd downs, the higher their conversion percentage. However, there are some interesting exceptions. Ohio State outperformed their counterparts with the highest 3rd down conversion rate in the Power 5 at .552. Wisconsin, Alabama, and LSU were experts at getting in 3rd and short situations.
It doesn’t look like being pass-heavy on 3rd downs really favors or disadvantages you based on the graph – the darker bubbles (pass-heavy teams) are fairly spread out high and low on the graph.
Despite regularly being in 3rd and long situations, Mississippi State and Louisville actually outperformed many of their counterparts with shorter distances to go on average, namely Duke and Washington.

4th down conversion rates and yards to go were all over the place, as expected. But some teams converted at a very high rate, like Alabama, Wisconsin, UNC, and VT. Some did not fair so well, like Tennessee, Texas, Stanford, and Maryland.
It looks like teams prefer passing the further they have to go, which makes sense. It doesn’t appear to help all that much.
Looking at the grand scheme of all teams, broken out by down
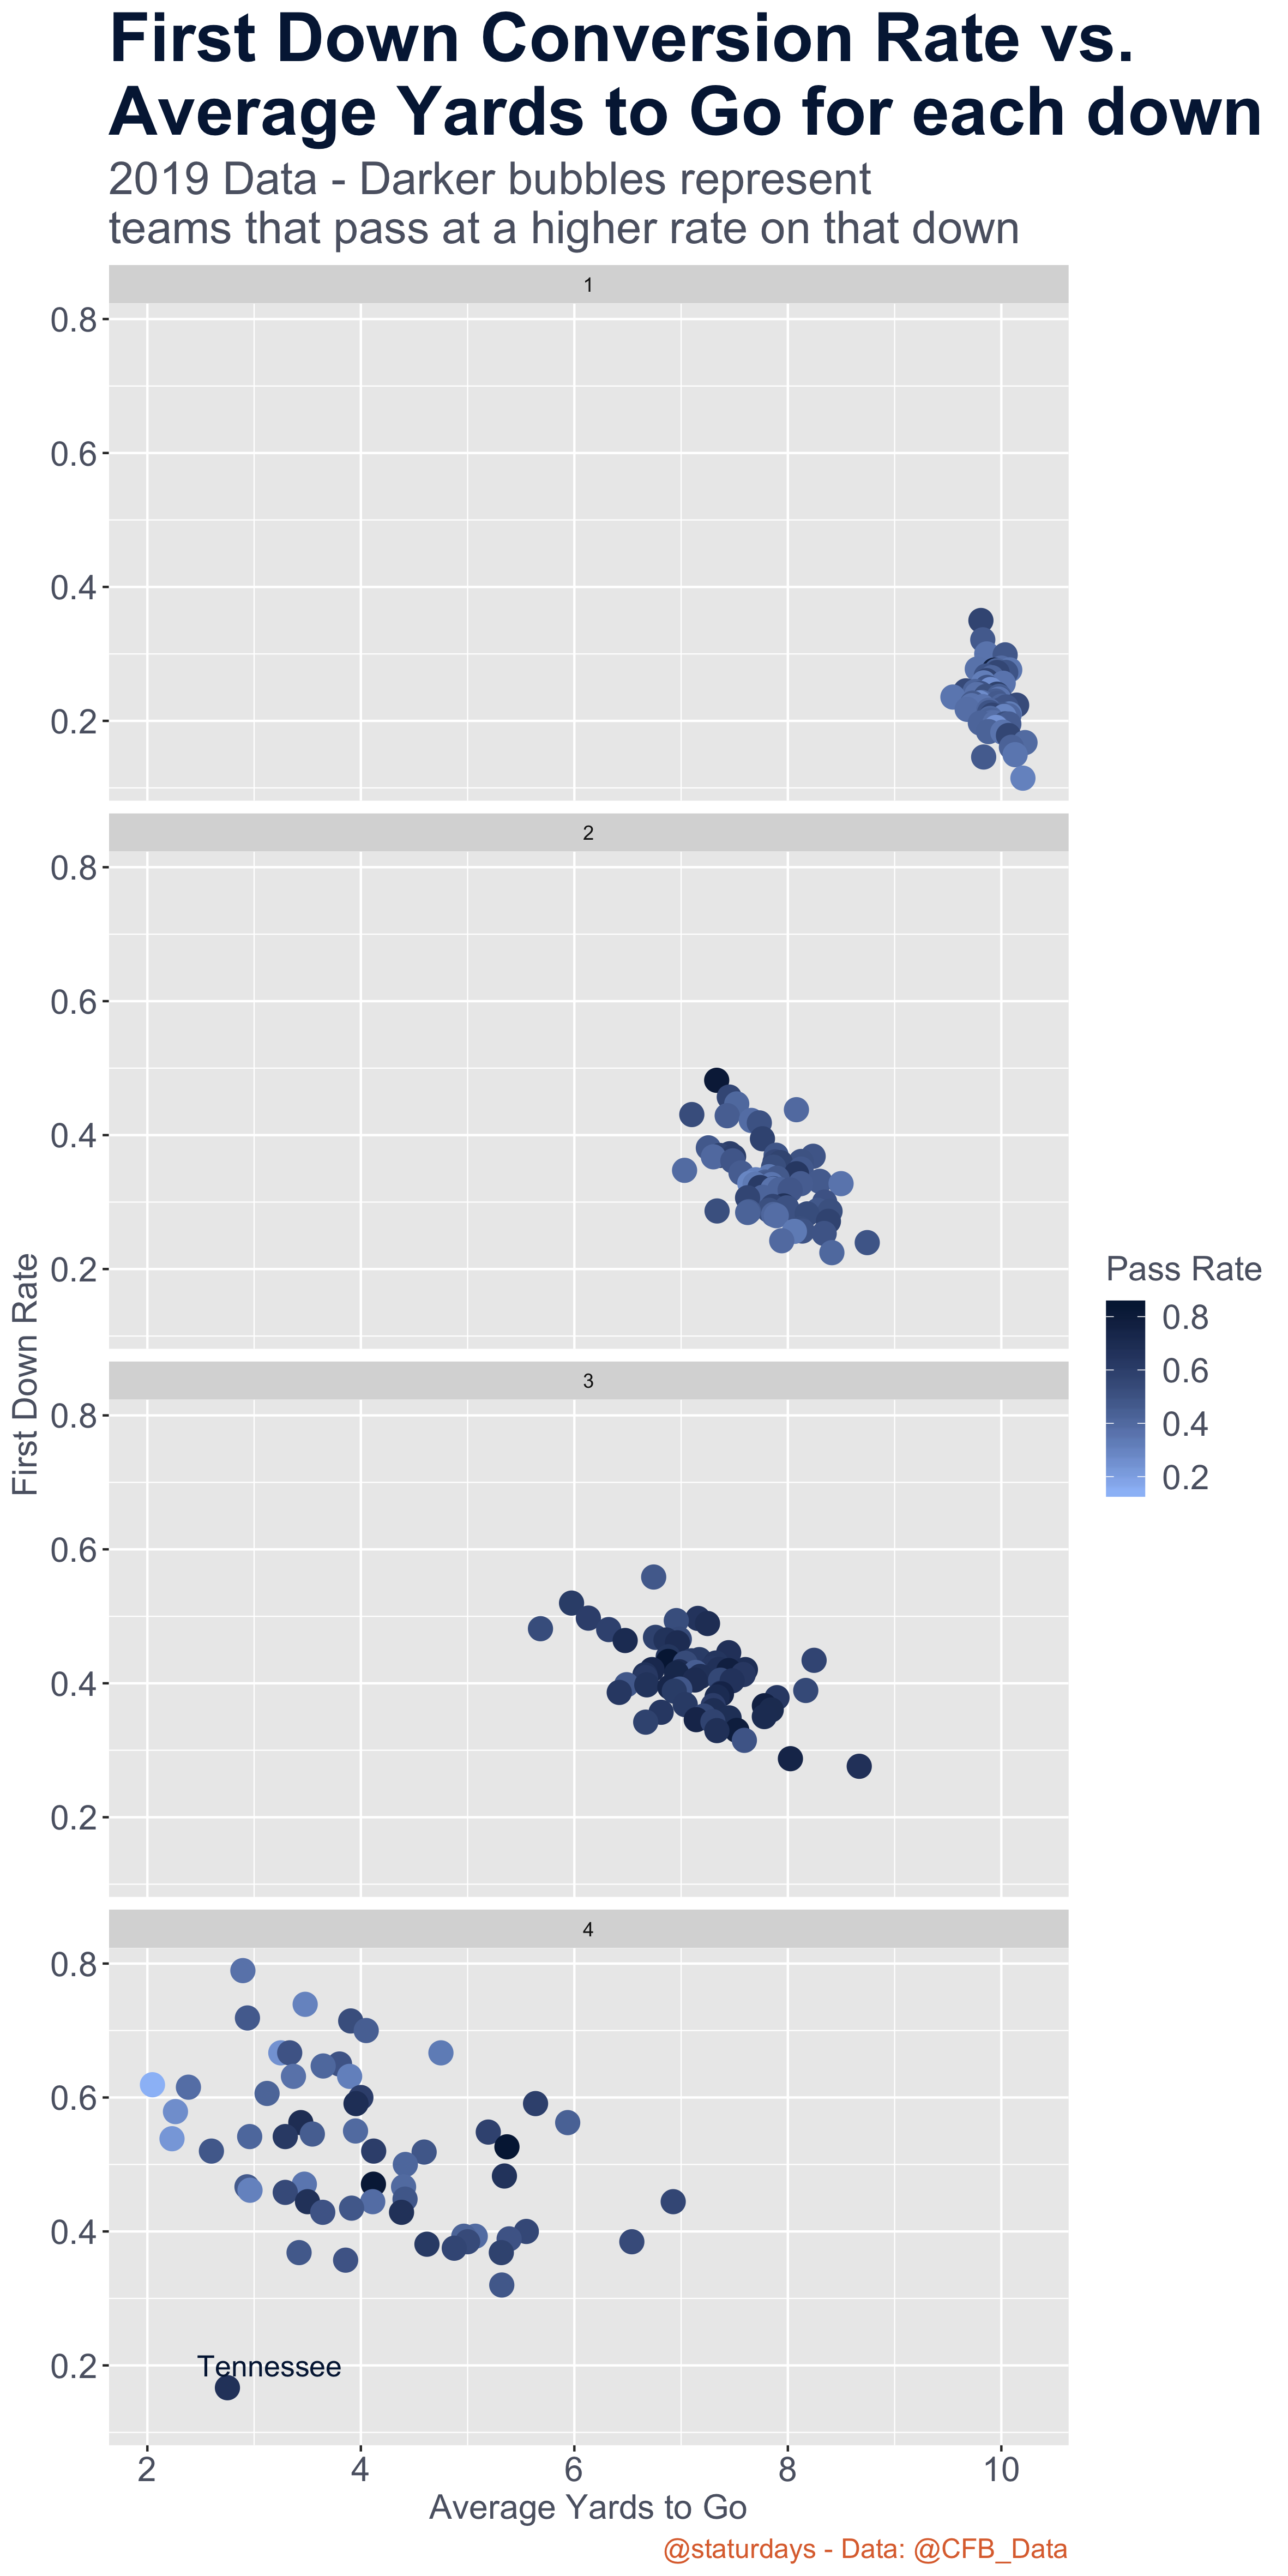
This graph shows the first-down conversion rate for each team by down and starting position. Obviously, on 1st down, teams usually have 10 yards to go, and conversion rates are low. What’s interesting is when we get into 2nd and 3rd downs, where there is a noticeably higher tendency to pass on 3rd downs, even though the distance to go is shorter.
What this graph tells me is that teams should probably be passing more on 2nd down (not an uncommon point-of-view). Tennessee… wow – just wow. They converted less than 20% of their 4th down attempts with less than 3 yards to go on average.
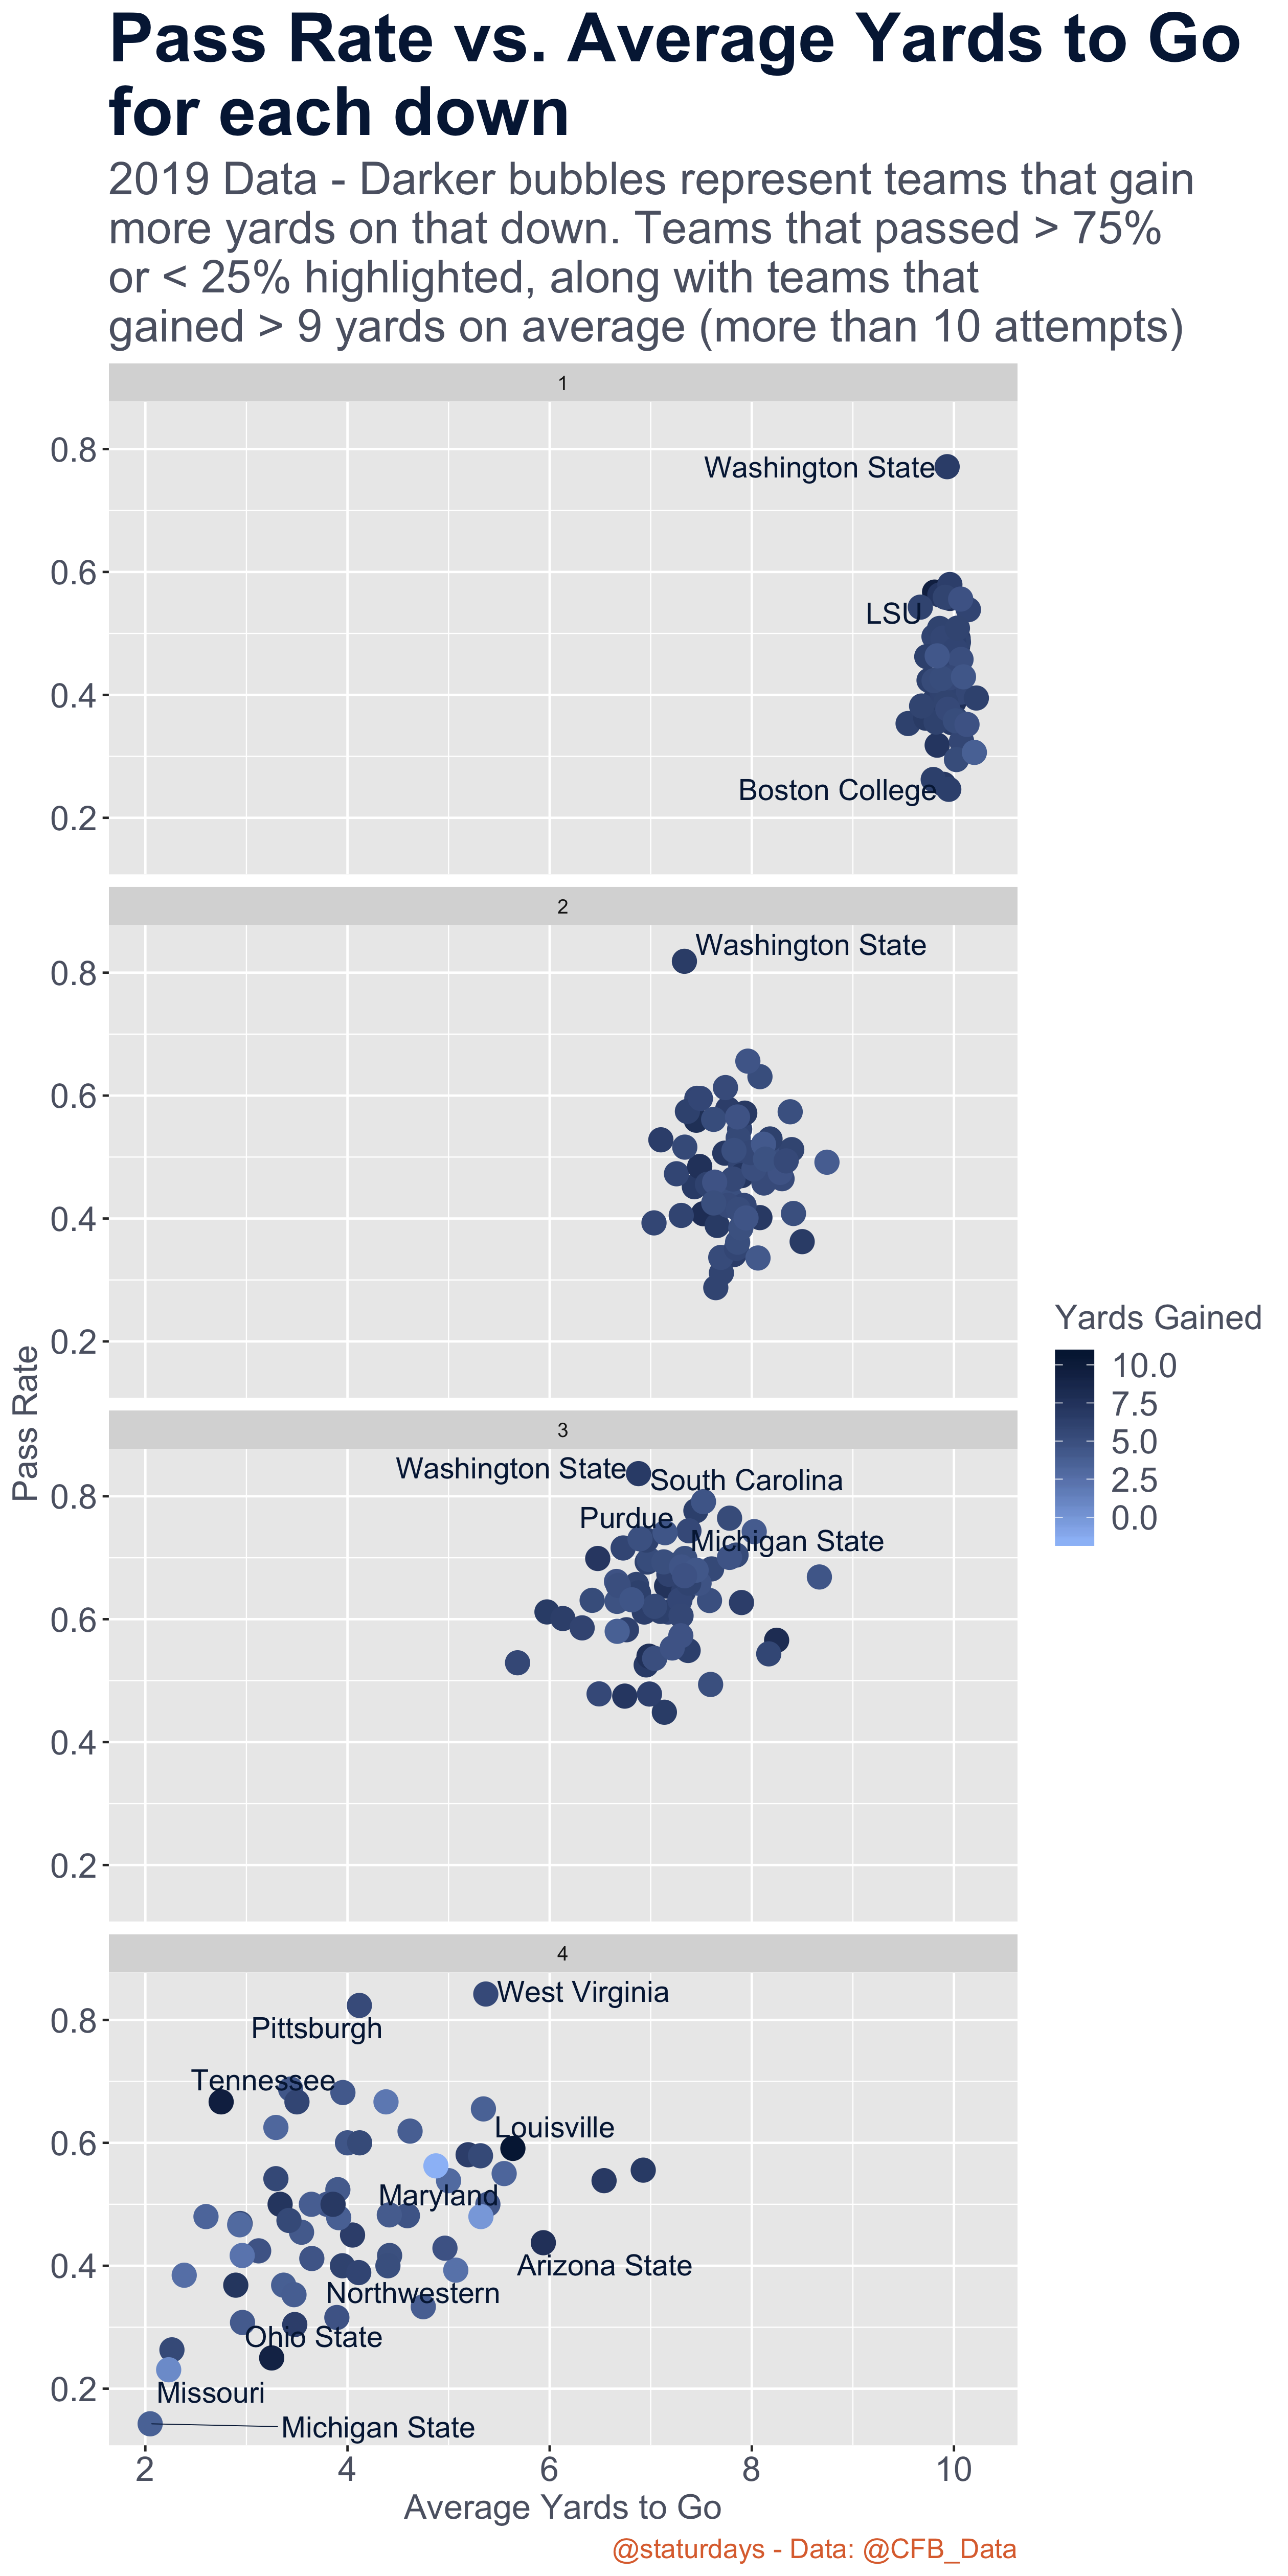
Here are the teams that pass the most, broken down by yards to go and down. This doesn’t show much else, but it is interesting to see who the major passers are on each down. No surprise the air raid Washington State offense is the top of all standard.
Boston College running on three-quarters of 1st down attempts seems a bit bizarre in this day and age, huh?
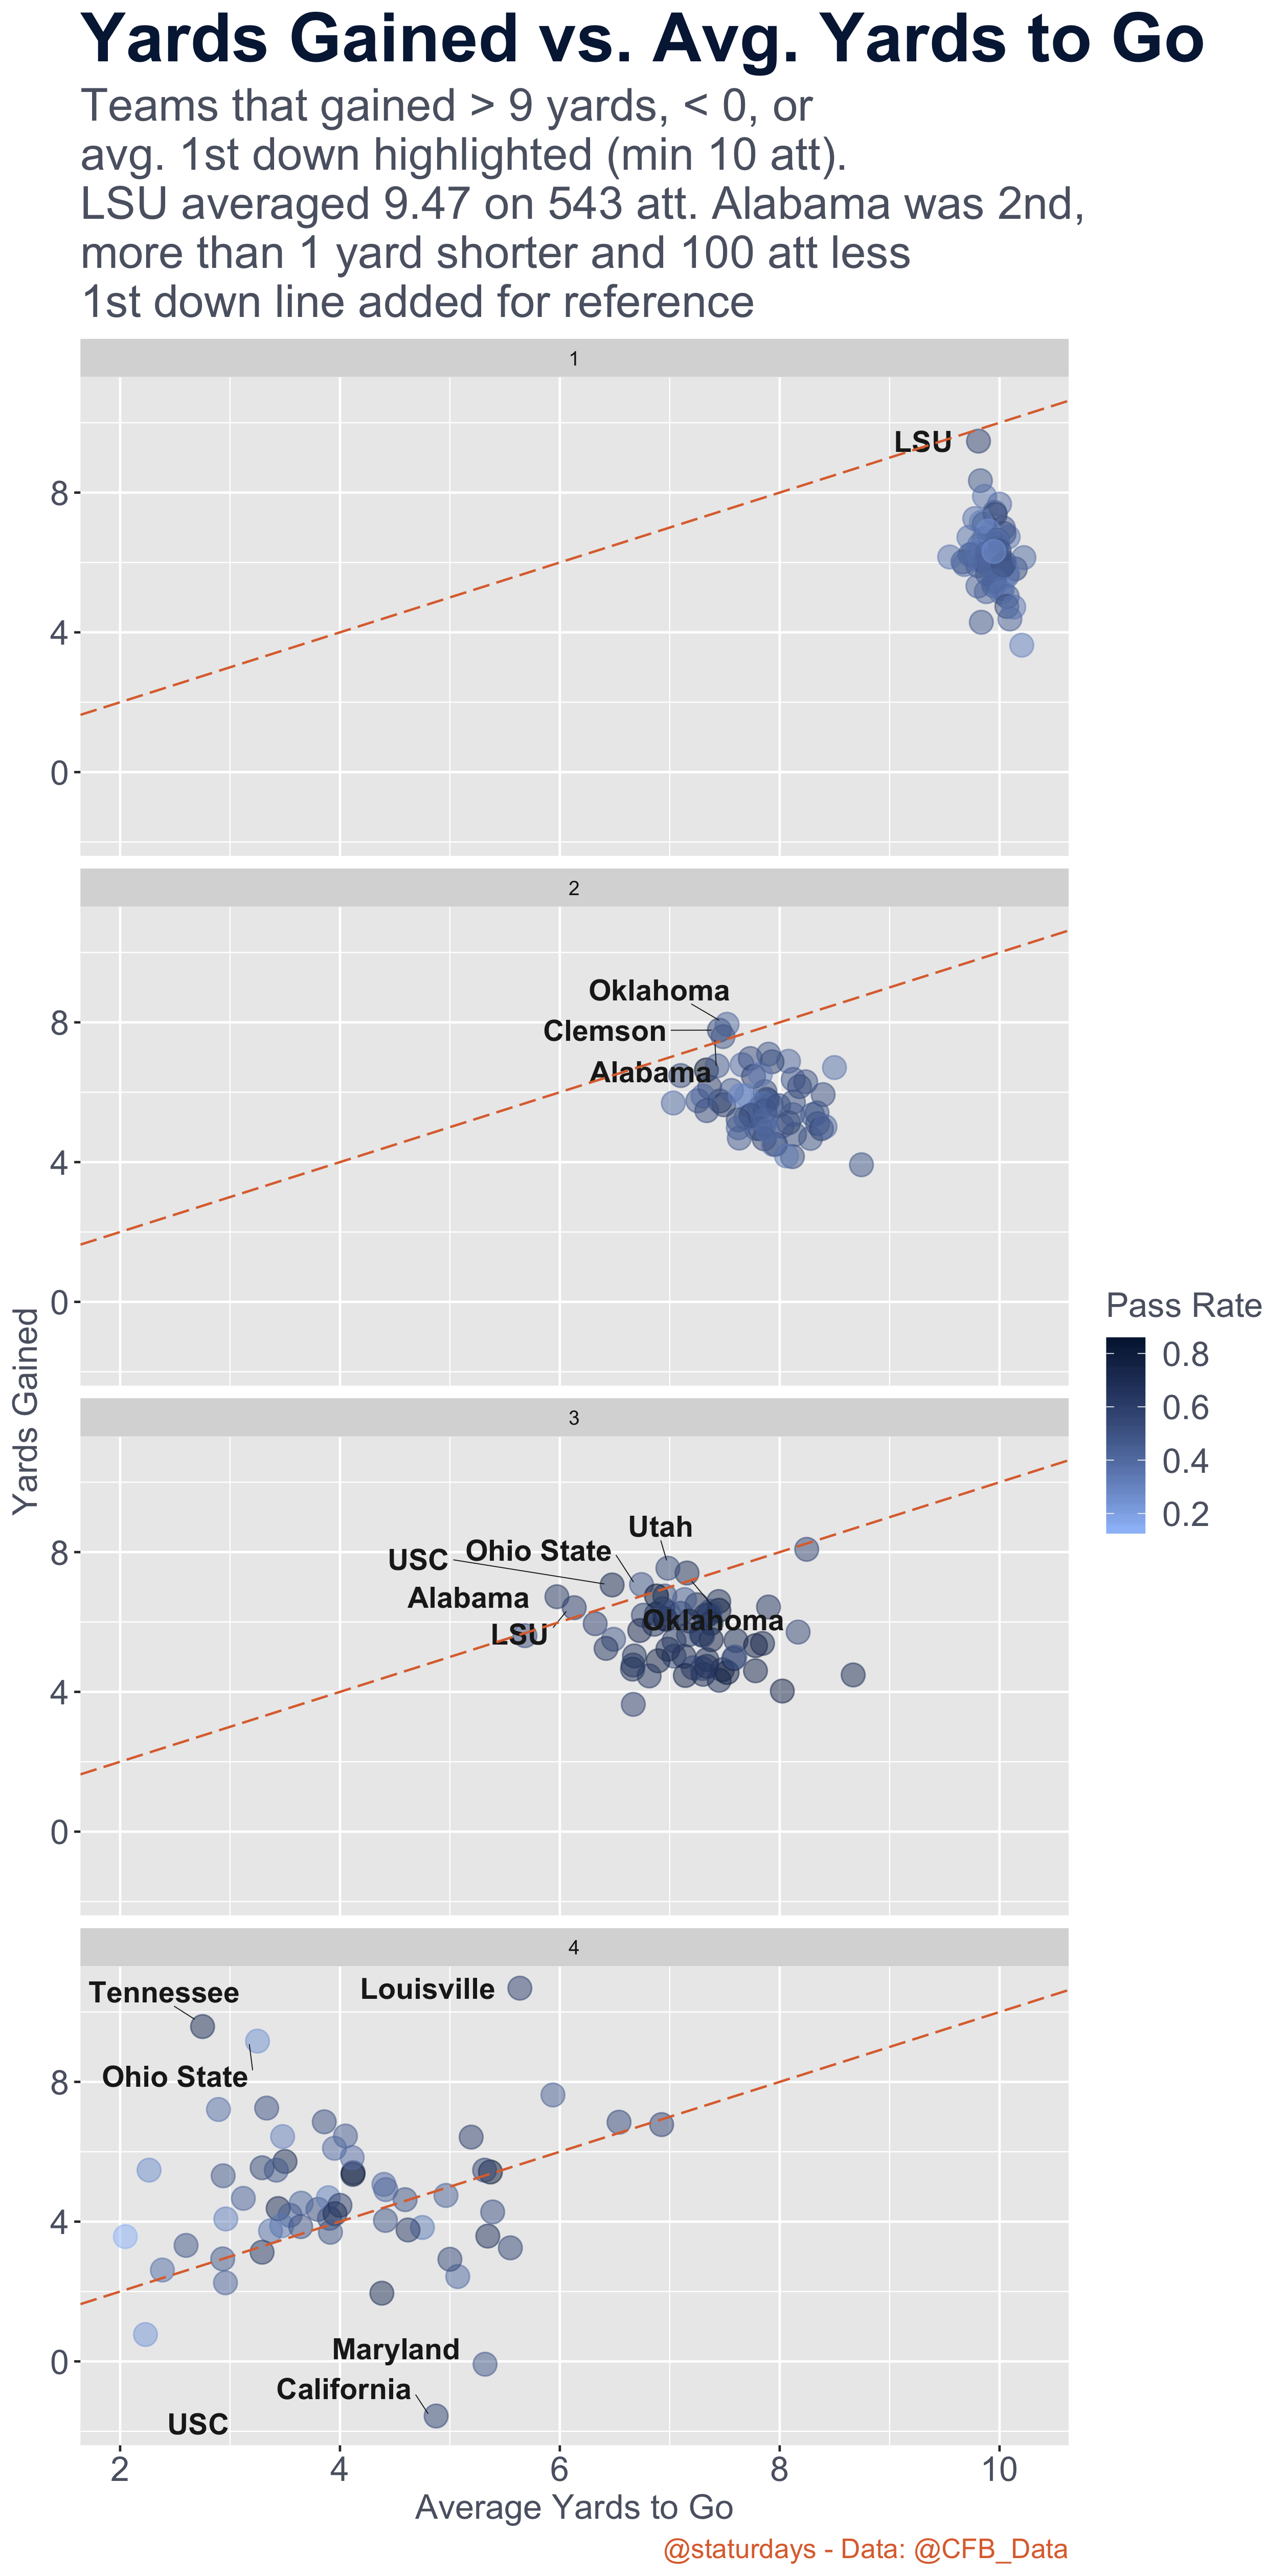
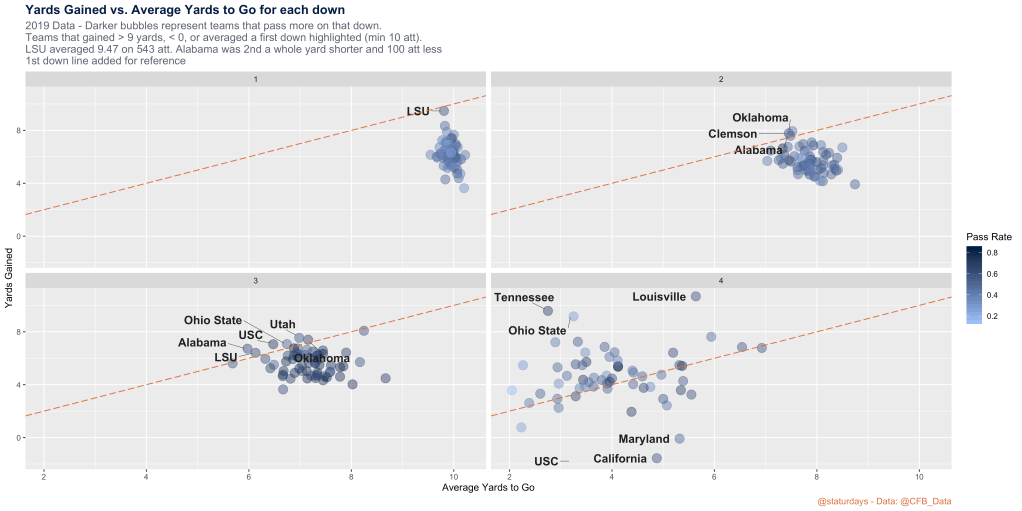
This one is pretty fun. It’s just yards to go vs. yards gained on each down. And it’s honestly the most insane of any of the graphs, because look at LSU. They nearly averaged a 1st down on 1st downs! In my opinion, this graph is the best indicator of who the best teams are because it is showing the teams that pick up (or nearly pick up) 1st downs on each down.
And look who’s at the top on 1st and 2nd downs particularly: LSU, Clemson, Alabama, and Oklahoma. As Warren Sharp always says, early-down aggressiveness is a key-factor in winning football games, and we are not seeing enough of it at present. And it doesn’t always mean just passing on early-downs (LSU passed on 57% of 1st downs, which is 22nd highest). Oklahoma only passed on 40% of 2nd downs too. Of course, it helps to just be dominant regardless of whether you run or pass, but it’s interesting. Dial up your big plays (be it a run, pass, or trick-play) on early downs and you can reap the rewards.