Sports

  • Race Control — Live Blog: 2026 Indycar Grand Prix of St. Pete — Race

    Race Control — Live Blog: 2026 Indycar Grand Prix of St. Pete — Race

    🏁 Checkered Flag

    Palou wins the Grand Prix of St. Pete in dominant fashion. He makes it two years in a row winning the season-opener. McLaughlin holds on for 2nd and Lundgaard ends in 3rd, tied with Rinus Veekay for 10 overtakes.

    Lap 93/100

    McLaughlin and Lundgaard pass Kirkwood!

    It’s too late for P1, but the battle for P2 is now Chevy on Chevy.

    Lap 92/100

    McLaughlin is officially stuck behind Kirkwood, and Lundgaard behind McLaughlin. The gap is under half a second between each of them.

    Kirkwood actually has the fastest lap by six tenths with a 62.2, but Palou has been able to maintain a consistently lower lap time overall. He has taken care of the tires and made the fuel go long on the first stint.

    Lap 88/100

    Palou is actually faster than those on reds behind him now.

    Lap 85/100

    Still a stalemate on laptime. It’s like Palou knows the pace his competitors are going to run before they run it, and he does nothing more, nothing less. Just maintaining the 5.7s gap.

    Lap 82/100

    Laptimes among the top 3 stabilized on that last lap. All between 63.2-63.4.

    Lap 80/100

    The gap is down to 5.5s for Kirkwood. They’re reeling Palou in, but is Palou saving something for them when they get there?

    Palou has only made one on-track pass. The rest of the lead was down to his pace on that first stint in-lap, and then his pace on the second stint helped him maintain that lead.

    Jameis Winston’s Son

    His son has been “studying cars by drawing them.” He’s ready to join an engineering team on the grid.

    Kirkwood’s Race

    Kirkwood has moved up 11 spots with 9 overtakes.

    Push to Pass

    Palou leads the top 3 with 90 seconds of PTP. McLaughlin with 80, Kirkwood with 51.

    Lap 74/100

    McLaughlin and Kirkwood are pushing about .5s per lap faster than Palou.

    Lap 73/100

    Effective order:

    1. Palou
    2. Kirkwood (-7.2)
    3. McLaughlin (-8.6)

    Lap 69/100

    McLaughlin in.

    Looks like teams are prioritizing safety against a yellow to a short final stint. Seems the tires are holding up on the longer stints.

    Lap 67/100

    Palou is in. He’s looking at a 32 lap black stint. I’m a bit surprised he didn’t take the reds longer.

    Lap 66/100

    Armstrong made a wild attempt into Turn 1 and gave up 2 spots in the end. The field is getting racy.

    Now Lundgaard gets by as Ericsson dives into the pits.

    Lap 65/100

    McLaughlin moves into P2 with an overtake of Ericsson into Turn 1.

    We’ll see what kind of pace he has with clear air as he chases down Palou.

    Lap 59/100

    To add to the pain, Palou’s pulled out a 6 second gap on P2.

    Fuel Update

    Palou has 3 laps on McLaughlin and 2 laps on Ericsson. He’ll be able to go deepest in this stint. Quickest final stop should be in store for him.

    McLaughlin’s best hope at this point could be to pit on the early side and hope Palou gets caught out with a yellow. You’re not going to win the fuel-save battle against him at this point.

    Lap 55/100

    Last lap times:

    • Palou: 63.0
    • Ericsson: 63.9
    • McLaughlin: 64.0

    All on soft reds.

    McLaughlin’s First Stop

    Traffic and slow in laps hurt McLaughlin. He didn’t pull away from Ericsson or Palou on his in laps, and then got stuck battling on his out laps.

    🟩Green Flag – Lap 44/100

    Palou leads. He will need to take hard black tires for the final stint (presumably around lap 80). McLaughlin will have the tire advantage on a set of soft reds.

    🟨Yellow Flag #2

    McLaughlin Radio

    Their goal is track position and going “at least as long or longer” than their competitors on this stint.

    Effective Order

    Palou, Rossi, Ericsson, McLaughlin, Armstrong

    Radio

    McLaughlin’s engineer is saying “Woulda coulda shoulda” on how deep they took that first stint.

    Dixon lost his right rear. Loose wheelnut. So unfortunate.

    Stint 2

    Lap 40/100

    Pit sequence complete and the overcut was the clear winner.

    Lap 38/100

    Palou just did a 62.8. That was a much faster in lap than McLaughlin was a ble to do on the hard tire.

    Editor’s Note

    The live map is about 20-30 seconds ahead of live radio, which is about 2 minutes ahead of the broadcast. Makes it pretty hard to keep track of what’s happening when.

    Lap 36/100

    McLaughlin in.

    Lap 34/100

    McLaughlin is pushing, a 63.9 on that last lap. Now a 63.5. The soft runners behind are mostly keeping up though.

    Lap 32/100

    Rahal in 9th up 5. Dixon up to 11th with 6 overtakes and 2 pitstops in hand. Watch out for him. He’ll be able to take this stint longer, get on cycle with the others, and have a shorter final pitstop because he’ll need less fuel.

    Lap 27/100

    I spoke too soon. There’s no discernable difference between softs and hards from what I can see in the recent laptimes.

    Lap 25/100

    Will Power is out. Same spot as his previous incident.

    Radio: “12 more laps on these tires”. Looks like the target lap is 37.

    Reds appear to be falling off now, about .2-.5 slower than the blacks.

    Lap 23/100

    O’Ward is the fastest on the primaries of those yet to pit, with a 63.7 last lap.

    Lap 21/100

    Radio: “Tires starting to go” according to Louis Foster.

    However, the primary hard tires were slower last lap. The leaders did a 64.1 and the first soft runners did a 63.8.

    Lap 19/100

    This is looking to be a 2 stop race. Same start, different result. Perhaps due to the two-soft rule.

    Radio: Half tank of fuel was the call. Could put the absolute last stops around lap 37/38.

    Lap 17/100

    The hard and soft tires are both equal still at this point in terms of lap time, it appears. Both tires running around a 63.4.

    Lap 16/100

    Alexander Rossi has 1 pitstop done and 5 overtakes complete. He’s in P16 at the moment.

    Lap 13/100

    Anddddd Malukas’s left front gave out. He’s nursing it back to the pits.

    Lap 7/100

    Malukas has flatspotted his hard tires already. He’ll have to get them through the next 7 laps at least before he thinks about going to softs, but imagine he’ll be an early pitter once the window opens.

    We’re green again.

    Yellow Flag

    One notable early pitter: Scott Dixon.

    So far no takers from the lead group on pit row.

    Radio: lap 15 is the target lap for the first stint to optimize the stint length on the red tires. Per the broadcast, teams will need to do two stints on reds.

    Stint 1

    Look for early pitstops similar to last year.

    Full course yellow already after there’s commotion in the back: Schumacher, Ferrucci, Sting Ray Robb involved.

    Green Flag

    We’re green!

    Command

    There’s the command. We’re moments from the green flag.

    Strategy

    Last year, the first 6 laps were under caution and then the race went green the rest of the way.

    The winning strategy from Palou was a lap 2 stop, and then two more stops on laps 39 and 72, for 3 stops total.

    The early last stop allowed Palou to take over the lead on lap 75 and never look back.

    Look out for:

    • Taking cheap stops under yellow
    • Pitting early rather than going long

    Grid Walk

    I can’t believe I’m saying this but Jameis Winston actually crushed that grid walk assist. He’s a natural.

    Pre-Race

    Betting Odds

    If you’re a betting person, the odds for race one are intriguing. Palou (4th) is favored at +170 to win. McLaughlin (1st) is at +230, Ericsson (2nd) is at +900, and Hauger (R)(3rd) is at +1800.

    Track Stats

    To recap from yesterday:

    • the pole winner wins this race 19% of the time.
    • The top 5 win this race 71% of the time.
    • Someone in the top 10 wins this race 90% of the time.

    So we’re looking at any of McLaughlin, Ericsson, Hauger, Palou, or Malukas with the best shot to win this race. McLaughlin, Ericsson, and Palou have all won here before.

    O’Ward (8th) is the only other driver in the top 10 to have won here before.
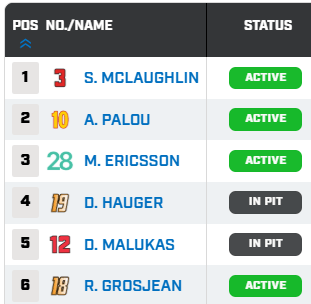
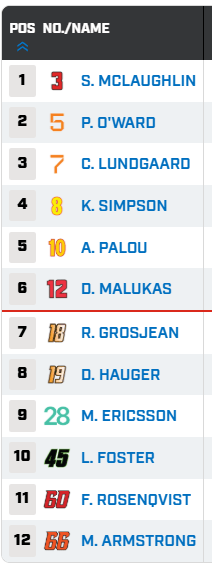
    Starting Grid

    We’re about 15 minutes away from the start of the first Indycar race of the 2026 season. Scott McLaughlin starts on the poll, with Marcus Ericsson 2nd and rookie Dennis Hauger 3rd. Palou is starting 4th.

    Here’s the full starting grid.

  • Live Blog: 2026 Indycar Grand Prix of St. Pete — Qualifying

    Live Blog: 2026 Indycar Grand Prix of St. Pete — Qualifying

    Trying something new this season, we’ll be live-blogging the Indycar series (with a stats-focused tilt, of course).

    Fast 6

    Your fast 6:

    Fast 12

    5:40 PM

    McLaughlin fastest by four hundredths over Palou. 4 Hondas and 2 Chevys yet again. Hauger, the rookie, advances to the Fast 6 as well.

    5:37 PM

    Everyone on reds now.

    5:34 PM

    4 of the top 6 so far on reds, including the top 3.

    5:33 PM

    Getting into golden hour in St. Pete. The sun looks difficult to deal with into turn 1, and then other parts of the track look very dark.

    5:30 PM

    Here’s the lineup for the top 12. Notably, no Power or Newgarden. Rookie Dennis Hauger is the biggest surprise.

    Q1

    5:26 PM

    Racing Reference is supplying a lot of these stats. It’s a great reference.

    5:24 PM

    There have been 4 winners from pole in 21 races, so today isn’t everything.

    Only 2 winners from outside the top 10 though (both Sebastian Bourdais). And only 6 winners from outside the top 5. So you want to be top 5 to have a decent shot.

    5:21 PM

    4 more Hondas and 2 more Chevys move through, and Dixon misses out after a late-session spin.

    5:18 PM

    The updates to the drivers eye are pretty awesome: live track map is a new bonus.

    5:14 PM

    Colton Herta is another driver who liked St. Pete. He had the highest average start in the field at 3.7. His average finish is 9th, though. (His dad, Bryan, has the all-time highest average finish at 4th.)

    Highest among active drivers is Dixon at 7.3.

    5:09 PM

    Will Power has an astounding 8 poles at St. Pete. The next best is Scott Mclaughlin with 2.

    5:07 PM

    Newgarden and Power are the only two active drivers with 2 wins each at St. Pete. Newgarden is already out of qualifying and Power is still acclimating to his new car.

    5:05 PM

    4 Hondas and 2 Chevys advance in the first group. Newgarden is the biggest surprise to not make it to Q2.

    5:00 PM

    The fastest lap in practice was a 61.1 by Scott McLaughlin. Could he repeat this year?

    4:55 PM

    We’re underway! Mick Schumacher is another big name in Indycar this year. He’s a rookie on Rahal Letterman Lanigan Racing. He was 23rd and 22nd in P1 and P2, respectively.

    4:55 PM

    Scott McLaughlin was the fastest qualifier last year with a 59.462. Colton Herta was 2nd, and Felix Rosenqvist was 3rd.

    4:49 PM

    Running a bit behind schedule. One of the biggest stories of the offseason was the move of career Chevy driver Will Power to Honda-powered Andretti Global.

    Power had one win in 2025 and finished 9th in the championship. We’ll see how he does under Honda power. He was 18th fastest in P1 and binned it early in P2 on a slippery track and didn’t set a time.

    4:40 PM

    The 2026 Indycar season starts this weekend in St. Petersburg, Florida. Everyone is chasing Alex Palou, who won 8 of 17 races in 2025, including the Indy 500, and won the championship by nearly 200 points.

  • Comparing Hurts vs. Mahomes and What Has Changed Since 2022

    Comparing Hurts vs. Mahomes and What Has Changed Since 2022

    As a Penn Stater (and yes, an Eagles fan) it makes me very happy to see Saquon Barkley getting a chance at a Super Bowl ring after suffering with the Giants for a few seasons. From the initial reaction I saw, not everyone was pleased with a Chiefs/Eagles game again. I had a small preference for the Bills over the Chiefs, but now they get a chance to beat the best. Even though this is a rematch of the Super Bowl two years ago, there are still a number of things that have changed since the last time these two played. To prepare for the game I spent some time playing with the publicly available play by play data to see what interesting things we can find out about this matchup.


    Using data from the nfldatapy Python library, I primarily focused on the quarterback matchup we will see this week. To start, I was curious how the play calling distribution has changed since the last time these two teams played in the Super Bowl. Since that time, the Eagles have acquired Barkley (and lost Miles Sanders) and have a new offensive coordinator in Kellen Moore. For the Chiefs, Kareem Hunt is now the most used running back (Pacheco led the team in rushing attempts in 2022) and they have a new offensive coordinator since the last Eagles/Chiefs Super Bowl — but Matt Nagy has been around for a few years now in that role with the Chiefs, so it’s not his first season (or Super Bowl) with the Chiefs.

    In 2022, the Eagles averaged 31 pass attempts/game and 32 rushes/game per pro-football-reference. In 2024, that has shifted to 26 pass attempts/game and 36 rushes/game. (For this article I used all games to keep things simple, but acknowledge that Hurts only played in 15 games missing a few with an injury, and Mahomes also sat out the last game of the regular season.) The Chiefs were closer to their 2022 distribution this season, averaging 38 pass attempts/game in 2022 (vs. 35 pass attempts/game this season) and 24 rushes/game (vs. 26 rushes/game).


    Adding Barkley only increased the rush attempts/game by +4. But those extra 4 rushes/game (a 12.5% increase over 2022) resulted in a 21% increase in total rushing yards in 17 games (with 2022 including the Super Bowl in those stats). The Eagles’ success rate on rushing plays (defined as gaining at least 40% of the yards required on first down, 60% on second down, and 100% on third and fourth downs) decreased from 56.3% in 2022 to 47.7% in 2024. Of course, rushing stats are going to be a combination of play calling, running back performance, and offensive line performance, so there are a few factors at play here with these evaluations. I was surprised to see the success rate lower with Barkley than with the 2022 Eagles, but some of this could be related to the attention Barkley attracts. His explosiveness might cause defenses to try to stop the run more, making the average play less successful but still having a rushing attack that produces more yards overall due to enough big plays — Barkley has had 21 runs that went 20+ yards this season (5.1% of his attempts) vs. 9 runs for Sanders of that length in 2022 (3.0%).

    Looking at the passing matchup, Hurts is averaging 6.1 air yards per completed pass vs. 4.5 for Mahomes. (A quick search for Air Yards rankings reveals various numbers for season long averages — my method here is using nfldatapy to remove two point conversion attempts and sacks when calculating averages and otherwise trusting their air yards column.) On incomplete passes Hurts is averaging 11.0 air yards/attempt vs. 10.5 air yards/attempt for Mahomes. Not surprisingly, average attempted air yards is higher for incomplete passes than completed passes, but I was surprised Hurts had a higher average air yards in both categories (I don’t watch all Chiefs games, so this is just based on what I have seen).


    The next item I looked at were the favorite targets of both players. The following table shows the top five most targeted players by each quarterback, with the percentage of targets shown:


    Brown and Smith lead the way for the Eagles with 24.5% and 22.0% of targets, respectively. For the Chiefs, Kelce is the most targeted (24.1% of targets) followed by Worthy at 18.3%. The top five targets for Hurts account for 80.8% of all targets, while the top five for Mahomes only account for 67.9% of targets. Although I didn’t look into it for this article, comparing the distribution of pass targets to team success or other metrics would be interesting to see if there are any trends there (does a more even distribution of who you throw the ball to really impact any metrics?).


    What I really wanted to create was a map of targeted locations on the field for each quarterback (like I did for a Penn State/Iowa game in 2020), but that data is not publicly available to download yourself for NFL and I certainly didn’t chart every game, though you can play with these on the Next Gen Stats website.

    That said, nfldatapy does provide information on pass location broken out by left/middle/right side of the field. We can then combine this with air yards to get an idea of where players are passing the ball most, even if the exact location is not known. First I looked at the distribution of throws to side of field (left/middle/right) by complete vs. incomplete passes. The following table shows the distribution of passes that were thrown to each part of the field by quarterback separated by compete vs. incomplete attempts.


    The first thing that stuck out to me was the consistency of Mahomes in the distribution of throws to each side of the field when comparing complete vs. incomplete passes. All three distributions were within 0.5% of one another when comparing the completed pass sample to the incomplete pass sample. This is in contrast to Hurts, where 36.9% of his completed passes are to the right side of the field but 48.4% of his incomplete passes are to the right side of the field. Put another way, knowing whether a pass was completed or not would not be a helpful predictor in determining which side of the field Mahomes threw the ball to, but it would be helpful for predicting which side of the field Hurst threw it to. If it was a complete pass, we would guess it was most likely he threw to the left side of the the field.


    Combining our air yards and the field location data we do have access to, we can start to build a picture of where each quarterback throws the ball (regardless of whether the pass was completed or not). The following tables show the distribution of pass targets by air yards and location of the field:


    Nearly one out of every four pass attempts by Mahomes has negative air yards (23.2% of targets) vs. 14.5% for Hurts. The majority of both players pass attempts are in the 0-9 air yards category with 55.9% of Hurts passes falling in that category and 50.3% for Mahomes. Hurts had a slight preference for the left side of the field in that category (26.3% of all throws) and Mahomes to the right (21.3% of all throws). I would guess that a lot of the differences in side of field are down to scheme and where favorite targets line up/have routes going, but the data I am using does not have route information so it’s not easy to confirm that. Using FTN Data via nflverse we can find out that 13.6% of non-sack pass plays were screen plays for Mahomes vs. 8.3% for Hurts, which explains some of the negative air yard trend.


    The final analysis I did was looking at completion percentage vs. air yards of a pass attempt. Simply, does either quarterback have a higher completion percentage when throwing the ball a certain number of air yards? To answer this, I fit a simple regression model with air yards as the predictor and whether a pass was completed or not as the outcome variable. I chose a cubic model to capture some changes in accuracy by distance while offering up the ability to have more than one inflection point, if accuracy had a second shift at any point. (This is admittedly a simple model. Another option would be to group air yards into buckets and just report the average completion percentage, but I wanted a model that could show the probability of a completed pass for any individual attempt and the general trend.)


    The following chart shows the probability of a completed pass (y-axis) vs. air yards (x-axis). The model trend line is plotted and individual pass attempts are shown as points.


    Two items stood out to me. First, the trend lines track very closely from 0-25 air yards. Hurts has a slightly better predicted completion percentage in the 0-10 range and then Mahomes is slightly above in the 10-25 range, but they are relatively close. The second thing that jumps out is the divergence at around 25 air yards. After 30 air yards, Hurts completes around 43% of his passes and Mahomes completes around 20%. So why does the Hurts trend line jump up to 85% predicted completion percentage at 45 air yards? The primary reason (and the reason we wouldn’t want to use this model as is for predictions into the future) is that Hurts has far less pass attempts at that range and we are over fitting to the little data that is there.


    Although the previous table showed that both quarterbacks threw around 4% of their passes 30+ air yards, Mahomes has more pass attempts this season overall. Hurts has 16 passes of 30+ air yards to Mahomes’ 25, and once we filter for just 40+ air yard passes, we get just two samples for Hurts and 11 for Mahomes. Hurts completed 1/2 of 40+ air yard passes, while Mahomes completed only 22%. Some of this could come down to when each quarterback decides to throw the ball deep as well. If Hurts is more choosy in when he throws downfield, he might convert at a higher rate, but I wouldn’t expect that completion percentage to be 85% on balls thrown 45 yards in the air once we got a significant number of samples. So while we wouldn’t have a ton of confidence in this model to predict future completion percentages due to the small sample size, it does reveal some interesting trends about observed completion percentage this season. If/when Hurts does throw it deep, we might expect those situations to occur when receivers are more clearly open. If the splits of pass/run play choice from the regular season continue, we would expect Mahomes and Hurts to have an equal percentage of their passes down field, but Mahomes would have more overall chances, and we’d expect a lower completion percentage on those balls for him than Hurts based on our simple model.


    While this is really just the surface of things we could look into ahead of the game, I think the quarterback comparison is always interesting, particularly with run/pass tendencies and targets. Even though these two teams played just a few seasons ago in the Super Bowl, with the Eagles shifting more towards a run dominant team, the offensive matchup will look a bit different this time.