2025

  • How One setuptools Release Broke Everything, and What We Can Learn From It

    How One setuptools Release Broke Everything, and What We Can Learn From It

    If you work in python package development or maintenance, then your world may have stopped for a few hours on Monday afternoon.

    To most, it probably felt like one of those “random” errors that pops up one day and is gone the next, but behind the scenes were hundreds of developers arguing back and forth on the public GitHub repository of setuptools over the best way to rectify a breaking change that broke more than anticipated.

    What Happened?

    It all started on Monday morning with a major release of setuptools which began failing build for what was previously a deprecation warning about using dashes or uppercase characters in your setup.cfg file.

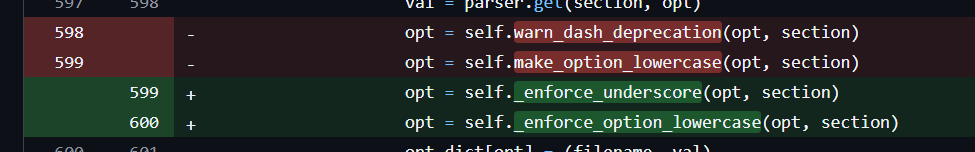
    Previously, setuptools would quietly fix your file for you, but for some reason in v78 they decided to start enforcing it.

    Funny enough, the 78.0.0 release initially failed because their own tests were failing due to a dependency, requests, not complying with their new rule. Rather than viewing this as a sign to take a moment to pause and consider the potential impact, they decided to comment out the tests.

    I say “they”, but in reality this was the rash decision by one individual developer who opened and merged their own PR with no reviewers, no requests for reviewers, and no comments.

    Once this release made it onto PyPI is when the trouble for everyone else started.

    It seems innocent enough: starting with v78, you need to correct your naming. It’s a simple fix. The problem was twofold, though:

    1. If you didn’t pin a top version of setuptools in your build specification, the newest version started being used by default, potentially breaking your package.
    2. Even if you fixed your own package, if any of your dependency packages were out of compliance (and not pinning their version of setuptools), then they would also cause your build to fail, namely if their package needed to be built from source (as is the case in Linux). This is why the pain was most immediately felt in a lot of people’s CI workflows on GitHub.

    So now there was this cascading effect of having to fix your own package (no big deal, usually), but then having to ask others to fix their packages (many of which–as many in the comments of the faulty PR pointed out–were no longer being actively maintained).

    Again, all of this was apparent when the setuptools tests themselves were failing because of requests (a python software foundation package) being out of compliance.

    How Was It Resolved?

    Fairly quickly, issues started popping up in the repos of packages that were out of compliance asking them to quickly fix their setup.cfg files. It’s hard to say how many packages were out of compliance, but rest-assured it would’ve taken weeks to months to get everything resolved across all the packages out there. People quickly realized this was too big an issue to deal with in this way. In the case of one package, pyspark, the fix was opened in a PR, but the pyspark tests take several hours to run (and they failed), so it was not exactly a quick-fix and they needed to do that on several still-supported minor versions of the package.

    So, the discourse in the setuptools PR space was to revert the changes and yank the bad versions in the meantime. Thankfully this only took a matter of hours, the release succeeded, and things quickly went back to normal. However, it revealed a lot of the flaws in open-source software development and the inherent risks of relying on these tools that we take for granted on a daily basis.

    What Did We Learn?

    1. Pin a Version Range

    If every package had set a max version of setuptools to something they knew they were compatible with, then this wouldn’t have happened. Of course, we can only control what we do in our own package. In this case, pinning setuptools wouldn’t have helped us if our dependencies didn’t do the same, but generally this is not the case and pinning our requirements can save us from running into these breaking changes unexpectedly. For GitHub Actions, pin a specific, immutable commit hash.

    2. Don’t Ignore Deprecation Warnings

    While I still think this breaking change was done poorly, the fact is that this deprecation warning was out there since 2021. When you ignore deprecation warnings, you’re taking a risk. Unless you are completely pinned down.

    3. Choose Your Dependencies Wisely

    When designing your system, build around well-supported and actively maintained projects. Leveraging fringe packages with little support or below their first major version release is risky, especially at the enterprise level where reliability matters.

    4. Respect SemVer

    For all the criticism, one thing you can’t argue is that setuptools followed SemVer. Most people cannot say the same. If you are instituting a breaking change, you must increment the major version number. This indicates to your users that it is not necessarily safe to just bump the version without checking things out first. You can tell that most people do not respect SemVer because most packages, even long-standing ones like numpy and pandas, are still only on version 1 or 2. The odds that they have not incorporated at least some if not many breaking changes in all those patch and minor versions is low.

    5. Understand Why Your Tests Broke

    Writing tests can be hard. Understanding tests is even harder. Debugging odd failures, especially ones that pop up during CI/CD, can feel insurmountable. However, it’s an essential skill and, as we saw on Monday, can be the difference between catching a crucial issue and unleashing hurt on others. Had the setuptools developers actually resolved the cause of their test failure rather than commenting it out, they would’ve seen that the solve was going to cascade to hundreds of other packages and maybe would have held off on the release until they could effectively communicate the change with others.

    6. Don’t Merge Your Own PR’s

    This might be the golden rule in my opinion; it really is that important. You cannot just shoot from the hip, especially on a public repository that is such critical infrastructure to the python packaging community. Request reviewers. Get a second and third pair of eyes on your code. Had they done so, someone certainly would’ve questioned why commenting out a test was the best course of action.

    7. Deprecation Warnings Need to Come With A Timeline

    Crazily enough, a user in the discussion tab of the setuptools repo predicted this exact situation almost 3 years ago. They asked how they were supposed to determine which deprecation warnings were most urgent, noting that the one in question about naming syntax of config keys seemed “minor”.

    If you are planning to deprecate something, saying “will be deprecated in a future version” isn’t specific enough. You need to set a specific version or a specific date by which action needs to be taken.

    Additionally, you need to weigh the benefits and drawbacks of implementing these deprecations. When I told my coworker about the issue and the scope of people affected, his response was “all this over a stylistic choice?” Some things are not worth the trouble of enforcing if there’s no security, performance, or functional benefit to implementing it.

    Packages can throw out so many warnings that you become numb to them, so you really need to pick and choose your battles as a package developer.

    And the next time someone brings up the potential for something to maybe break a year or two from now, don’t roll your eyes! We just saw it happen, and it is destined to happen again soon.

    Is Open Source Actually The Holy Grail of Security?

    I’ll finish with a final thought: I tried to explain this situation to my fiancé Raychel: how one random guy in the UK brought down our and so many other packages around the world. She couldn’t believe that my company was relying on the packages of so many others outside of our control, and the contributions of random people around the world that we’ve never met. “That doesn’t sound very secure,” parroting back a phrase I often say to her in relation to her job.

    “No. Open source is the most secure because everyone can see it.” I told her this because it’s what I’ve been told. But between the setuptools issue that morning and the tj-actions security incident the week before, I was questioning this premise.

    Sure, the issues can get rectified fairly quickly once they’re noticed, but usually the damage is already done. The data was stolen, secrets exposed, or time lost. If one random guy in the UK could shut down packaging work for an afternoon, what else was possible? I think open source is for sure still better than the alternative, but it has its flaws, and some tightened guidelines around these critical packages–such as requiring PR reviewers–would be a really simple step in the right direction.

  • Comparing Hurts vs. Mahomes and What Has Changed Since 2022

    Comparing Hurts vs. Mahomes and What Has Changed Since 2022

    As a Penn Stater (and yes, an Eagles fan) it makes me very happy to see Saquon Barkley getting a chance at a Super Bowl ring after suffering with the Giants for a few seasons. From the initial reaction I saw, not everyone was pleased with a Chiefs/Eagles game again. I had a small preference for the Bills over the Chiefs, but now they get a chance to beat the best. Even though this is a rematch of the Super Bowl two years ago, there are still a number of things that have changed since the last time these two played. To prepare for the game I spent some time playing with the publicly available play by play data to see what interesting things we can find out about this matchup.


    Using data from the nfldatapy Python library, I primarily focused on the quarterback matchup we will see this week. To start, I was curious how the play calling distribution has changed since the last time these two teams played in the Super Bowl. Since that time, the Eagles have acquired Barkley (and lost Miles Sanders) and have a new offensive coordinator in Kellen Moore. For the Chiefs, Kareem Hunt is now the most used running back (Pacheco led the team in rushing attempts in 2022) and they have a new offensive coordinator since the last Eagles/Chiefs Super Bowl — but Matt Nagy has been around for a few years now in that role with the Chiefs, so it’s not his first season (or Super Bowl) with the Chiefs.

    In 2022, the Eagles averaged 31 pass attempts/game and 32 rushes/game per pro-football-reference. In 2024, that has shifted to 26 pass attempts/game and 36 rushes/game. (For this article I used all games to keep things simple, but acknowledge that Hurts only played in 15 games missing a few with an injury, and Mahomes also sat out the last game of the regular season.) The Chiefs were closer to their 2022 distribution this season, averaging 38 pass attempts/game in 2022 (vs. 35 pass attempts/game this season) and 24 rushes/game (vs. 26 rushes/game).


    Adding Barkley only increased the rush attempts/game by +4. But those extra 4 rushes/game (a 12.5% increase over 2022) resulted in a 21% increase in total rushing yards in 17 games (with 2022 including the Super Bowl in those stats). The Eagles’ success rate on rushing plays (defined as gaining at least 40% of the yards required on first down, 60% on second down, and 100% on third and fourth downs) decreased from 56.3% in 2022 to 47.7% in 2024. Of course, rushing stats are going to be a combination of play calling, running back performance, and offensive line performance, so there are a few factors at play here with these evaluations. I was surprised to see the success rate lower with Barkley than with the 2022 Eagles, but some of this could be related to the attention Barkley attracts. His explosiveness might cause defenses to try to stop the run more, making the average play less successful but still having a rushing attack that produces more yards overall due to enough big plays — Barkley has had 21 runs that went 20+ yards this season (5.1% of his attempts) vs. 9 runs for Sanders of that length in 2022 (3.0%).

    Looking at the passing matchup, Hurts is averaging 6.1 air yards per completed pass vs. 4.5 for Mahomes. (A quick search for Air Yards rankings reveals various numbers for season long averages — my method here is using nfldatapy to remove two point conversion attempts and sacks when calculating averages and otherwise trusting their air yards column.) On incomplete passes Hurts is averaging 11.0 air yards/attempt vs. 10.5 air yards/attempt for Mahomes. Not surprisingly, average attempted air yards is higher for incomplete passes than completed passes, but I was surprised Hurts had a higher average air yards in both categories (I don’t watch all Chiefs games, so this is just based on what I have seen).


    The next item I looked at were the favorite targets of both players. The following table shows the top five most targeted players by each quarterback, with the percentage of targets shown:


    Brown and Smith lead the way for the Eagles with 24.5% and 22.0% of targets, respectively. For the Chiefs, Kelce is the most targeted (24.1% of targets) followed by Worthy at 18.3%. The top five targets for Hurts account for 80.8% of all targets, while the top five for Mahomes only account for 67.9% of targets. Although I didn’t look into it for this article, comparing the distribution of pass targets to team success or other metrics would be interesting to see if there are any trends there (does a more even distribution of who you throw the ball to really impact any metrics?).


    What I really wanted to create was a map of targeted locations on the field for each quarterback (like I did for a Penn State/Iowa game in 2020), but that data is not publicly available to download yourself for NFL and I certainly didn’t chart every game, though you can play with these on the Next Gen Stats website.

    That said, nfldatapy does provide information on pass location broken out by left/middle/right side of the field. We can then combine this with air yards to get an idea of where players are passing the ball most, even if the exact location is not known. First I looked at the distribution of throws to side of field (left/middle/right) by complete vs. incomplete passes. The following table shows the distribution of passes that were thrown to each part of the field by quarterback separated by compete vs. incomplete attempts.


    The first thing that stuck out to me was the consistency of Mahomes in the distribution of throws to each side of the field when comparing complete vs. incomplete passes. All three distributions were within 0.5% of one another when comparing the completed pass sample to the incomplete pass sample. This is in contrast to Hurts, where 36.9% of his completed passes are to the right side of the field but 48.4% of his incomplete passes are to the right side of the field. Put another way, knowing whether a pass was completed or not would not be a helpful predictor in determining which side of the field Mahomes threw the ball to, but it would be helpful for predicting which side of the field Hurst threw it to. If it was a complete pass, we would guess it was most likely he threw to the left side of the the field.


    Combining our air yards and the field location data we do have access to, we can start to build a picture of where each quarterback throws the ball (regardless of whether the pass was completed or not). The following tables show the distribution of pass targets by air yards and location of the field:


    Nearly one out of every four pass attempts by Mahomes has negative air yards (23.2% of targets) vs. 14.5% for Hurts. The majority of both players pass attempts are in the 0-9 air yards category with 55.9% of Hurts passes falling in that category and 50.3% for Mahomes. Hurts had a slight preference for the left side of the field in that category (26.3% of all throws) and Mahomes to the right (21.3% of all throws). I would guess that a lot of the differences in side of field are down to scheme and where favorite targets line up/have routes going, but the data I am using does not have route information so it’s not easy to confirm that. Using FTN Data via nflverse we can find out that 13.6% of non-sack pass plays were screen plays for Mahomes vs. 8.3% for Hurts, which explains some of the negative air yard trend.


    The final analysis I did was looking at completion percentage vs. air yards of a pass attempt. Simply, does either quarterback have a higher completion percentage when throwing the ball a certain number of air yards? To answer this, I fit a simple regression model with air yards as the predictor and whether a pass was completed or not as the outcome variable. I chose a cubic model to capture some changes in accuracy by distance while offering up the ability to have more than one inflection point, if accuracy had a second shift at any point. (This is admittedly a simple model. Another option would be to group air yards into buckets and just report the average completion percentage, but I wanted a model that could show the probability of a completed pass for any individual attempt and the general trend.)


    The following chart shows the probability of a completed pass (y-axis) vs. air yards (x-axis). The model trend line is plotted and individual pass attempts are shown as points.


    Two items stood out to me. First, the trend lines track very closely from 0-25 air yards. Hurts has a slightly better predicted completion percentage in the 0-10 range and then Mahomes is slightly above in the 10-25 range, but they are relatively close. The second thing that jumps out is the divergence at around 25 air yards. After 30 air yards, Hurts completes around 43% of his passes and Mahomes completes around 20%. So why does the Hurts trend line jump up to 85% predicted completion percentage at 45 air yards? The primary reason (and the reason we wouldn’t want to use this model as is for predictions into the future) is that Hurts has far less pass attempts at that range and we are over fitting to the little data that is there.


    Although the previous table showed that both quarterbacks threw around 4% of their passes 30+ air yards, Mahomes has more pass attempts this season overall. Hurts has 16 passes of 30+ air yards to Mahomes’ 25, and once we filter for just 40+ air yard passes, we get just two samples for Hurts and 11 for Mahomes. Hurts completed 1/2 of 40+ air yard passes, while Mahomes completed only 22%. Some of this could come down to when each quarterback decides to throw the ball deep as well. If Hurts is more choosy in when he throws downfield, he might convert at a higher rate, but I wouldn’t expect that completion percentage to be 85% on balls thrown 45 yards in the air once we got a significant number of samples. So while we wouldn’t have a ton of confidence in this model to predict future completion percentages due to the small sample size, it does reveal some interesting trends about observed completion percentage this season. If/when Hurts does throw it deep, we might expect those situations to occur when receivers are more clearly open. If the splits of pass/run play choice from the regular season continue, we would expect Mahomes and Hurts to have an equal percentage of their passes down field, but Mahomes would have more overall chances, and we’d expect a lower completion percentage on those balls for him than Hurts based on our simple model.


    While this is really just the surface of things we could look into ahead of the game, I think the quarterback comparison is always interesting, particularly with run/pass tendencies and targets. Even though these two teams played just a few seasons ago in the Super Bowl, with the Eagles shifting more towards a run dominant team, the offensive matchup will look a bit different this time.

  • Mahomes Isn’t The Only One Flag-Baiting

    Mahomes Isn’t The Only One Flag-Baiting

    There was a lot of noise this weekend—and rightly so—about Patrick Mahomes baiting defenders into late hits in hopes of drawing flags. He was able to get one early on in the game, but didn’t fool the refs later on when he loitered on the edge of the boundary and then flopped out of bounds once defenders arrived.

    For a lot of fans, I think the frustration came fast because it was reminiscent of another moment earlier in the season when Mahomes drew a foul on another (questionably) late hit.

    This was in the 3rd quarter:

    And then the no-call in the 4th quarter:

    This was a similar play that went viral earlier in the season where Mahomes danced near the sidelines and turned it into a big gain:

    To be fair to Mahomes, there were many more examples (just search “Patrick Mahomes late hit” on your favorite social media platform) throughout the season where flags were not thrown for hits near the sideline.

    Interestingly, if you search the same terms with “Josh Allen”—probably the second most popular quarterback in the NFL—it returns a lot less results. So it does seem like Mahomes is a bit of an anomaly due to his outsized celebrity (maybe from all the State Farm commercials).

    But I did want to try to find out if there was truly some bias towards Mahomes and the Kansas City Chiefs in general when it comes to these late hit fouls. So I took a look at the play-by-play data from nflfastR and FTN Data via nflverse, which charts certain movement data like whether a QB went outside the pocket.

    Before we begin, there are two terms to define here. A QB scramble is defined by nflverse and is always a run play. It’s basically anytime a pass turns into a QB run. The QB being out of the pocket is anytime the QB exits the pocket.

    A QB scramble almost always means the QB is out of the pocket, but a QB being out of the pocket does not imply a QB scramble. In fact, a QB being out-of-the-pocket is a pass 68% of the time to a run 24% of the time, and is a QB scramble 25% of the time.

    The base dataset is all plays where a penalty was called on the defense that were not interceptions or fumbles lost.

    First off, I looked at unnecessary roughness and roughing the passer penalties specifically since these are the two penalties commonly called for late or illegal hits. According to the NFL rulebook, roughing the passer can be called inside or outside the pocket. If a QB is outside the pocket and on the move, they are allowed to be hit low or high (unlike when they are in the pocket), however if they stop moving and return to a “passing posture”, they can no longer be hit low or high again.

    The findings were interesting. Looking at plays where the QB was out of the pocket, Buffalo actually led the way with five unnecessary roughness or roughing the passer calls on the defense. KC only had one recorded.

    Unsurprisingly, some of the teams leading the way in this area have very dynamic, mobile quarterbacks: Josh Allen, Kyler Murray, Jayden Daniels, Justin Fields/Russell Wilson. However, the numbers are pretty low overall so far.

    Of course, the data is not perfect. There may be calls missed and charting data on in vs. out of the pocket is not always reliable either, plus it’s not guaranteed that the unnecessary roughness calls were called for hits on the quarterback. But we can still learn a lot from the general trends.

    Let’s cut the data a few more ways. First, let’s normalize for how many out-of-pocket plays a team has to see who’s getting the most calls proportional to the number of rollouts they do.

    All the below plots will be looking at the roughing the passer and unnecessary roughness calls only.

    Buffalo still leads the way on penalty calls when the QB is out of the pocket on a per-play basis, averaging about .3 penalty yards per out-of-pocket play, or about a call every 50 rollouts. As you can see, KC is near the bottom in this category.

    When we look at totals, the result is mostly the same. However, we’re only looking at one or two calls per team. Note that it is possible for the penalty to be less than 15 yards in both cases because they can be called within 15 yards of the goal line.

    Next, let’s look at QB scrambles where the QB becomes a runner. At this point, we shouldn’t see any roughing the passer calls but will still see the unnecessary roughness calls for late hits. There’s a lot less data here; there were only 10 unnecessary roughness calls out of 1181 QB scramble plays.

    Minnesota and Arizona both drew two of these penalties while the other teams had one. KC is notably not on this list (although please fact check me here because, as I said, the data may not be perfect. I was able to find two instances but they occurred on turnovers.)

    Last, let’s take off all the reigns and look at these two penalties across all plays, including those where the QB stays in the pocket.

    Here, Miami creep up as a big beneficiary of these calls (is Tua Tagovailoa’s injury history playing a factor here, perhaps?). Again, the Chiefs are very middle of the road here, showing no evidence of favoring Mahomes.

    On a total yardage view, there isn’t much change.

    Just for fun, let’s see who’s getting the most flags called against their opposing defense overall, without any filters on turnovers or penalty types.

    Here, we see that Minnesota, Washington, Dallas, and Buffalo drew the most penalties while Jacksonville, Indianapolis, and Detroit drew the least.

    While this is interesting, nothing really stands out and the distribution of penalties across the teams is fairly normal.

    So, to summarize, I think that fans have a short memory and also a memory that highlights the moments and players that are most infuriating and impactful to the result of the game. Patrick Mahomes is a world-class player and he’s on TV all the time. He’s also had some moments that have been A) on national television or B) gone viral where he has seemingly flopped or earned a call from the refs that was undeserved.

    That being said, I found no evidence in any of the data that the Chiefs get any more calls than other teams. In fact, they rank near the middle or bottom of most of the charts above.

    I agree that the NFL does need to figure out how to regulate the “QB as a runner” situation a bit better, because it is hugely disadvantageous to the defense when quarterbacks get these special protections near the boundaries that other players seem not to get. Whether it’s actually the case that these calls are made more often on quarterback runners than other runners is a whole other investigation (a quick glance gives me the impression that this is not actually the case).