LSU

  • Predicting the Heisman Winner After Kyle Trask’s 3-Interception Loss

    Kyle Trask was a “shoe”-in for Heisman. Now the shoe is on the other foot (Mac Jones’s).

    The name Kyle had gotten a bad rap in the last year. People think that all we do is drink Monsters and pop wheelies on our ATVs with our cousins at the campground. Kyle Trask was supposed to show the world that us Kyles are so much more. That we could be Heisman-winners and SEC champions too. Not so fast my friend.

    I cannot understate enough how consequential a single shoe has become to not only Kyle Trask’s Heisman campaign, but also Florida’s shot at a College Football Playoff spot.

    For those of you who have no clue what I’m talking about (doubtful, but possible), it’s probably easiest if you just watch this video.

    Let’s start with the latter: Florida were unlikely to beat Alabama as it were, with Elo giving them around a 20% chance to win the game (with the LSU loss). Had they done that, they’d easily be in the College Football Playoff. Now, it’s unclear if a two-loss Florida could get in regardless of the result of this game, unless they had a performance so dominant against the best team in the nation that it couldn’t possibly be a fluke. That is even less likely than them winning by any margin.

    Now the Heisman. Trask was a 52% favorite to win the Heisman last week. After a 3-interception loss, Kyle Trask dropped all the way to 11% odds (+800). Mac Jones went to the 66% favorite, followed by Devonta Smith at 33%. We’ve been working on a model to predict Heisman winners for the past two weeks using a few data sources from collegefootballdata.com. As of last week, Kyle Trask had the best odds to be the Heisman winner. Now, Jones has closed the gap.

    The two major stats that were negatively affected by that LSU loss were team record (8-2) and interceptions thrown (+3). Only one of those two is significant to determining the Heisman winner: team record.

    We built our model using data from 2004 through 2019, pairing up the most common passing, rushing, and receiving stats for each player with the eventual Heisman winner. This is inherently tricky because a Heisman winner is inherently rare. Out of about 42,000 player-season combos, there can only be 17 Heisman winners in that span. Despite that, we did a decent job of getting some fairly accurate Heisman odds historically, and the winner of the Heisman was the player with the highest odds in our model 11 out of 17 years.

    The most important and significant factors that determined whether a player might win the Heisman ended up being:

    • The team’s winning percentage in the regular season
    • A player’s rushing yards relative to others at their position in that season
    • Total Touchdowns per Game (it should be noted that total touchdowns for the season were pretty much equally significant, but since this season is shortened for some teams, we opted for the per-game stat)

    Interestingly, our model still did better at identifying true Heisman candidates when we included more variables, even if they were statistically insignificant. Some of the variables we left in despite their perceived unimportance were:

    • interceptions per game
    • player position
    • total yards per game
    • Power Five conference indicator

    The inclusion of these extra variables sniffed out a few clear outliers that weren’t even in consideration, namely the Cincinnati QB and RB, who have put up large numbers, but are not in a Power 5 conference, a defining characteristic of previous Heisman winners (despite that, P5 conference was still considered insignificant on its own, likely because so many Power 5 players do not win the Heisman each year, while many players who score 50+ touchdowns do (six out of 15, to be specific).

    Cincy QB Desmond Ridder also threw .75 interceptions per game this year, a seemingly insignificant amount, but not when Fields, Trask, and Jones average .6, .5, and .3, respectively. It’s a tough world out there these days.

    The results were fairly promising. Like I said, there are only 16 winners, and thousands of losers each season, so most players are going to have an essentially 0% chance of winning the Heisman. But when we look at the top 5 players in terms of Heisman probability each season, we see that the actual winner did in fact have much higher odds then the next four runner-ups, showing that our model is on the right track.

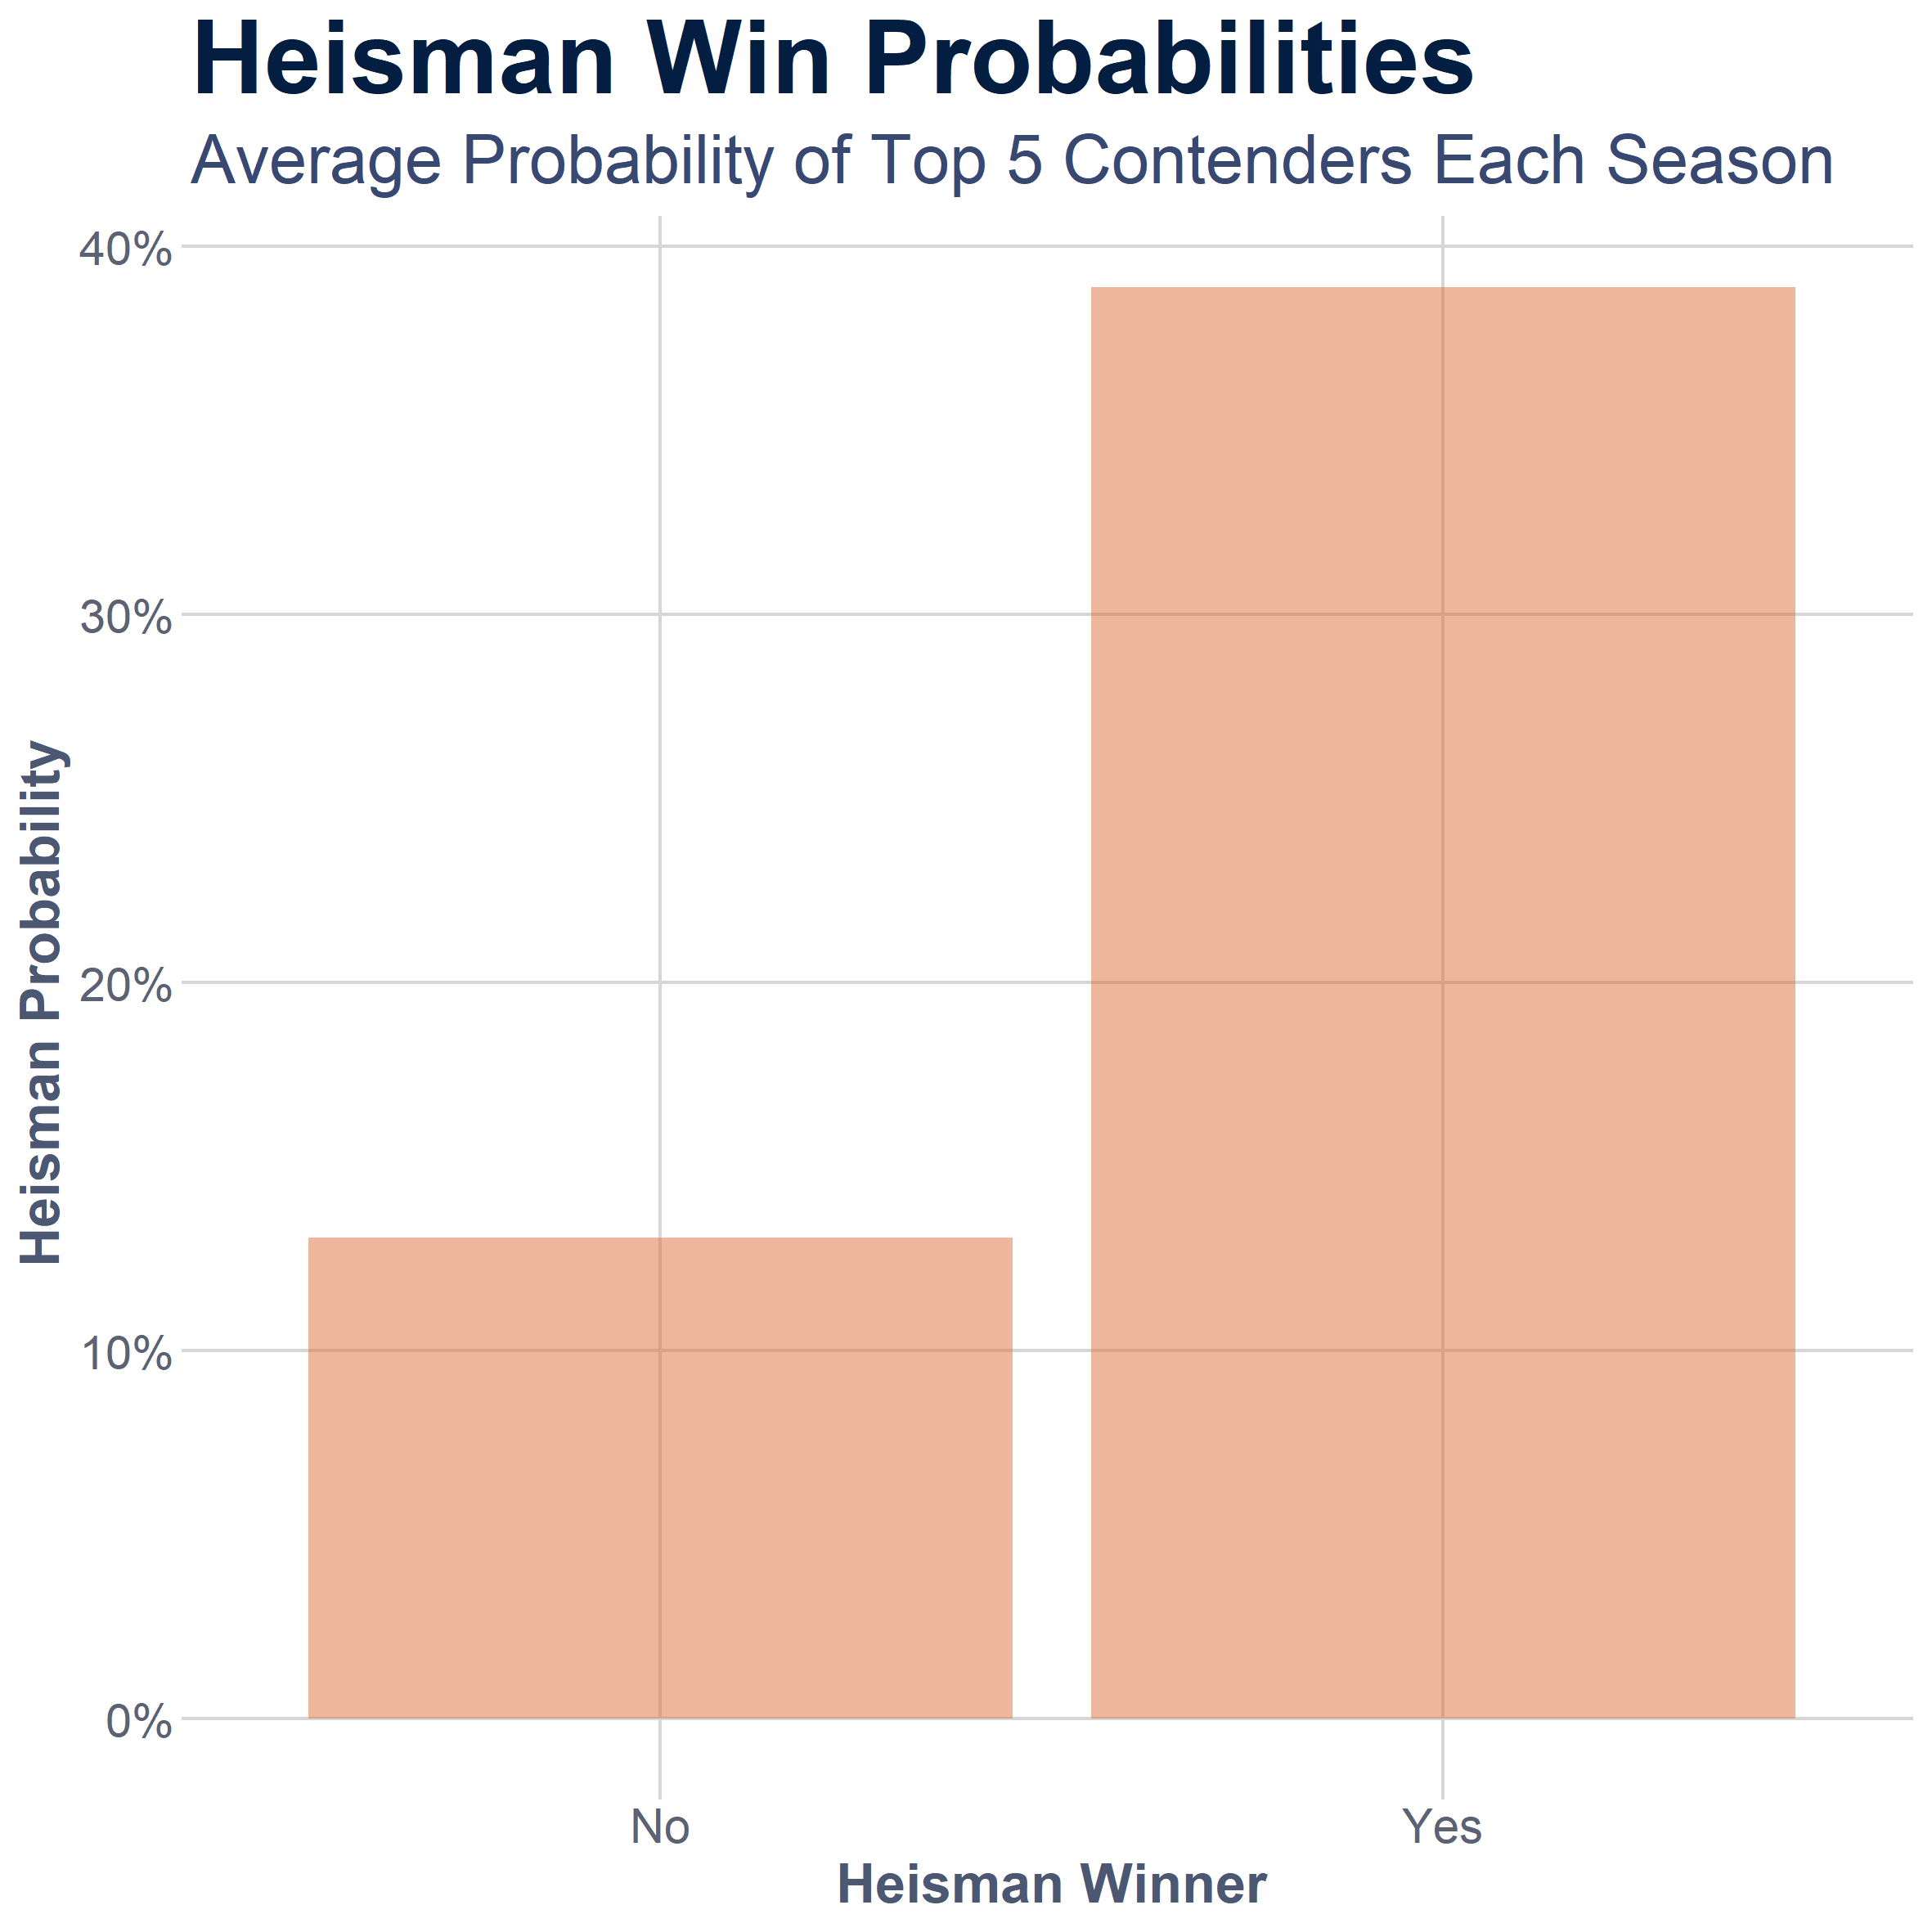
    So the actual Heisman winner usually had the highest win probability to win the award on average, while the runner-ups came in around 12% probability.

    Here is a look at how total TDs correspond to the probabilities to win the Heisman that our model gives.

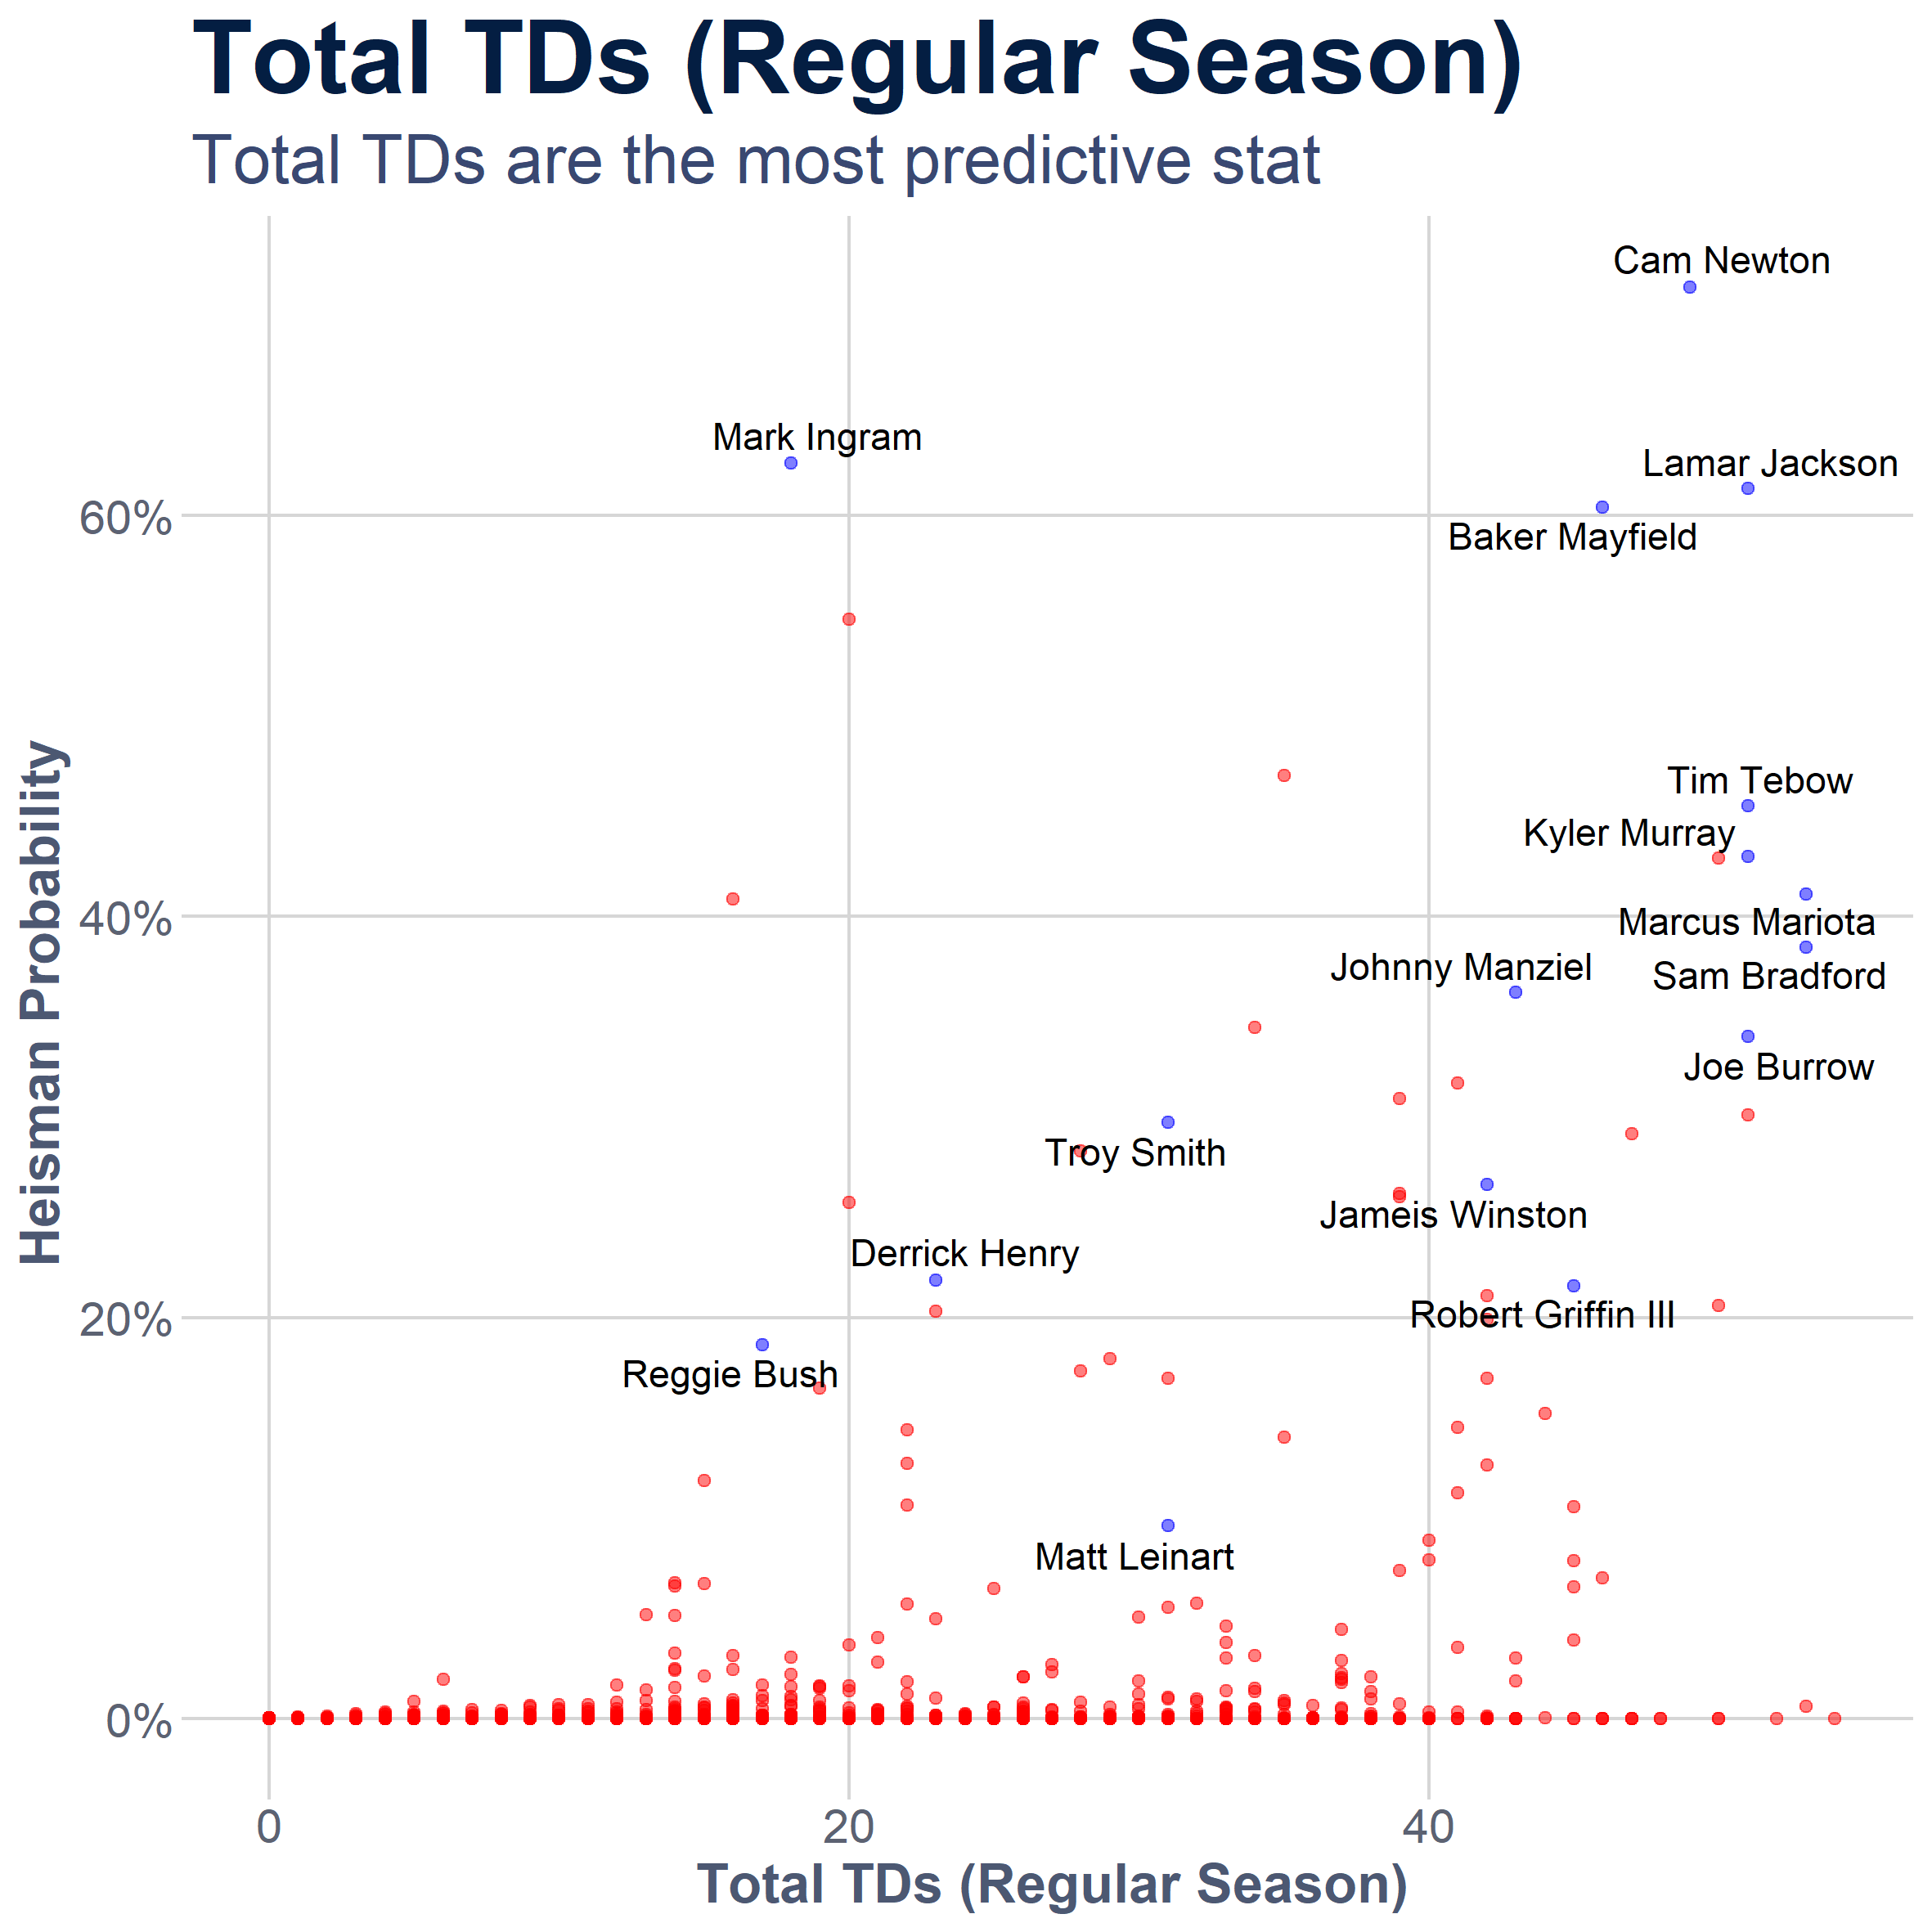
    This stat is clearly most important with QBs, as many of the Heisman-winning QBs had total TDs in the upper 40s or lower 50s. Matt Leinart and Troy Smith were two exceptions, with Leinart having the lowest predicted win probability of the players we looked at, undoubtedly helped by being the QB on an undefeated USC team that year.

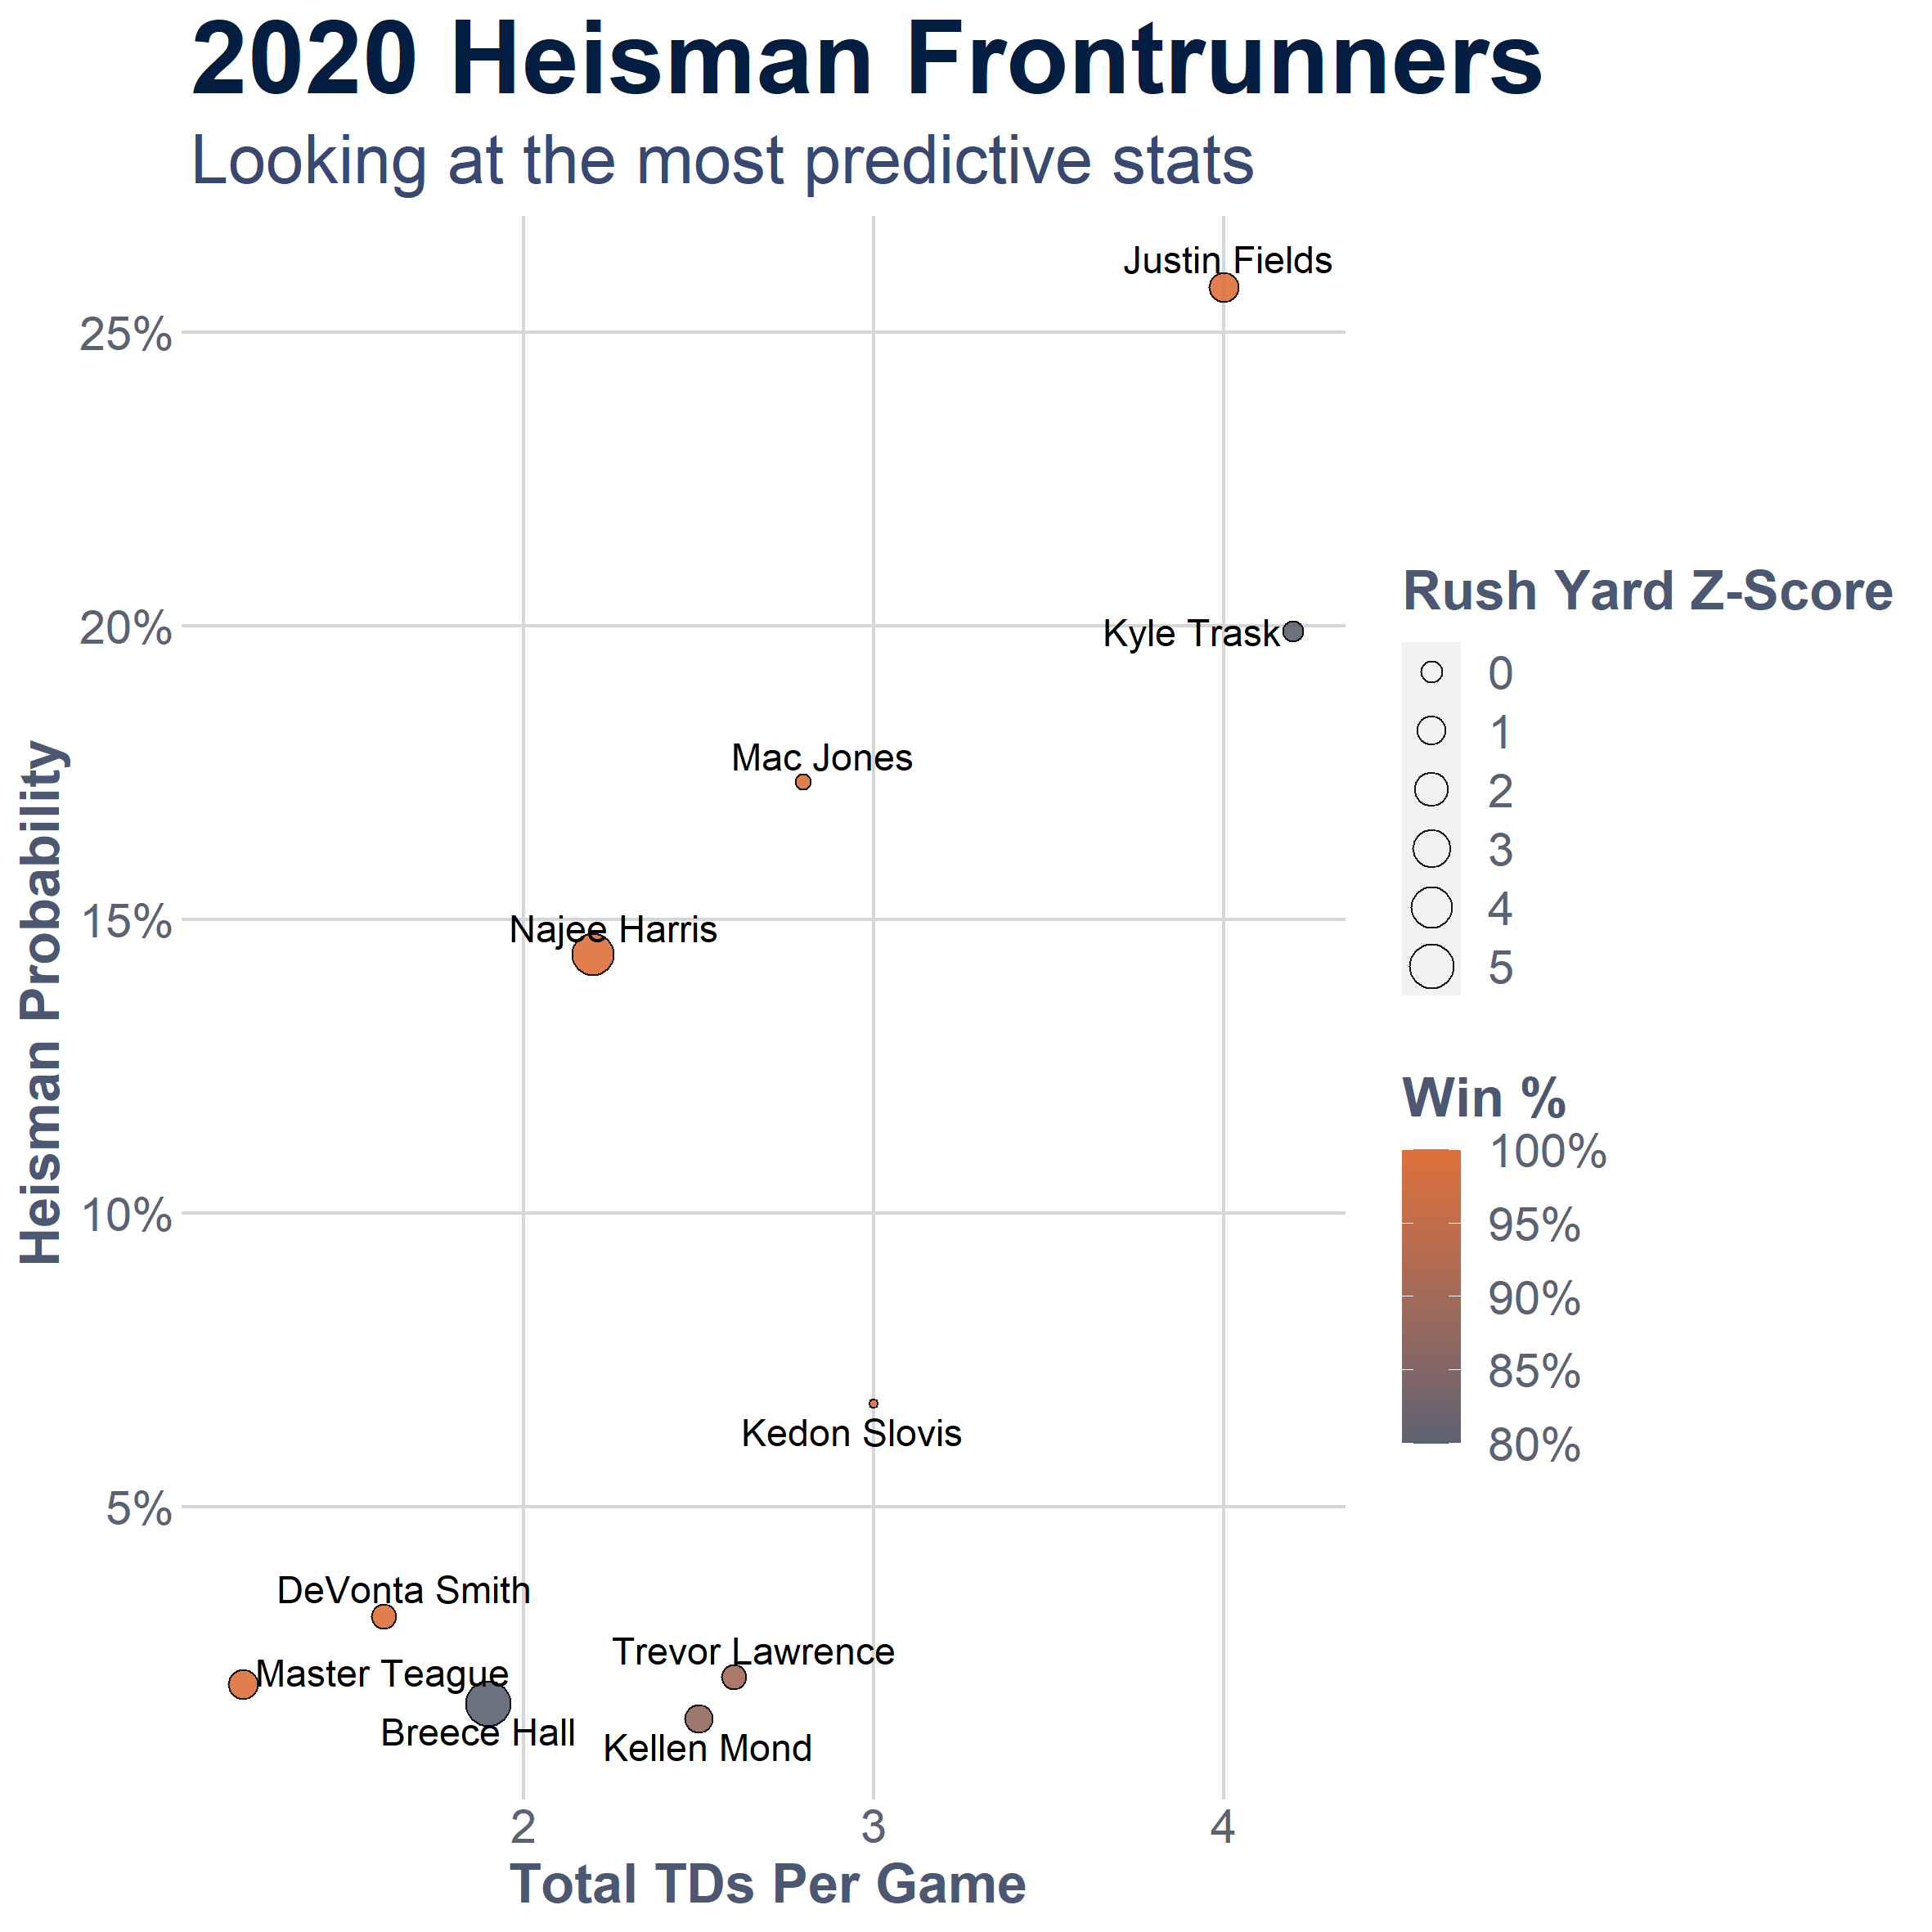
    So who are the Heisman favorites in our model this year?

    The top five this year are:

    1. Justin Fields (25.8% chance)
    2. Kyle Trask (19.9%)
    3. Mac Jones (17.3%)
    4. Najee Harris (14.4%)
    5. Kedon Slovis (6.7%)

    Now remember, we are using per game numbers here, but we can almost certainly rule out Slovis and Fields who will only have played six games by the time the ballots are cast: enough games to warrant a playoff spot, maybe, but not a “Most Outstanding Player in College Football” trophy.

    What you can take away from Fields sitting on top of our rankings is that he was on-track for a Heisman-caliber season.

    Despite losing to unranked LSU in a three-pick game, Trask still leads in our odds thanks to his considerable lead in total TDs and TDs/game (4.2 for Trask to 2.8 for Jones). However, you have to feel like this conference championship game will decide things one way or another, with the top 2 QBs facing off head-to-head. They are, after all, separated by only 2.6 percentage points in our probabilities, and TDs aren’t everything, as we saw in the above plot.

    For those wondering about DeVonta Smith, Alabama wide receiver, he comes in at #6, followed by Trevor Lawrence at #7. While Smith is certainly having a great year, he may be hurt by the fact that our 16 years of model-training hadn’t seen a WR win the Heisman once. That, and the fact that he has two teammates performing at equally, if not more historic levels.

    Najee Harris is performing at Top-10 levels at his position in terms of total TDs, compared to other RBs in 2020. In terms of TDs per game, he is also in the top ten, though many others above him did better, none of which won the Heisman. However, only one of them was also on an undefeated team: Jaret Patterson of Buffalo (this year), who are in the MAC. So Najee has a chance, but it seems unlikely despite his outperformance of his peers. The less-prestigious Doak Walker Award (for the top back in College Football)? For sure.

    Again, we have to discount Fields despite his stellar performance so far in the air and on the ground. You can see neither of the top QBs in contention have much of a run game, so it will come down to TDs and win percentage. I think Florida need to win on Saturday to get Trask his Heisman. Otherwise, it’s going to ‘Bama (but I won’t say who at ‘Bama).

  • The Best Teams in College Football at Getting First Downs

    The Best Teams in College Football at Getting First Downs

    Exploratory Data Visualizations of First Down Rate, Average Yards to Go, and Passing Rate by Down

    Like most of you, I am finding myself realizing that there is not much to do when you can’t make “plans”, per se. I decided to try to use some of my time productively this past weekend by messing around with some college football data (courtesy of @CFB_Data). The results paint an interesting picture about individual teams (just how good LSU was in 2019; just how much Maryland struggled on 4th downs), as well as overall trends in college football playcalling.

    So let’s just dive right into it. I won’t get into too much detail other than sharing my takeaways from some of these graphs. They’re not gamechanging, but they’re interesting to look at.

    Looking at individual teams on 3rd and 4th downs

    Intuitively, you see that the less yards teams have to-go on 3rd downs, the higher their conversion percentage. However, there are some interesting exceptions. Ohio State outperformed their counterparts.
    Intuitively, you see that the less yards teams have to-go on 3rd downs, the higher their conversion percentage. However, there are some interesting exceptions. Ohio State outperformed their counterparts.

    Intuitively, you see that the less yards teams have to-go on 3rd downs, the higher their conversion percentage. However, there are some interesting exceptions. Ohio State outperformed their counterparts with the highest 3rd down conversion rate in the Power 5 at .552. Wisconsin, Alabama, and LSU were experts at getting in 3rd and short situations.

    It doesn’t look like being pass-heavy on 3rd downs really favors or disadvantages you based on the graph – the darker bubbles (pass-heavy teams) are fairly spread out high and low on the graph.

    Despite regularly being in 3rd and long situations, Mississippi State and Louisville actually outperformed many of their counterparts with shorter distances to go on average, namely Duke and Washington.

    4th down conversion rates and yards to go were all over the place, as expected. But some teams converted at a very high rate, like Alabama, Wisconsin, UNC, and VT.
    4th down conversion rates and yards to go were all over the place, as expected. But some teams converted at a very high rate, like Alabama, Wisconsin, UNC, and VT.

    4th down conversion rates and yards to go were all over the place, as expected. But some teams converted at a very high rate, like Alabama, Wisconsin, UNC, and VT. Some did not fair so well, like Tennessee, Texas, Stanford, and Maryland.

    It looks like teams prefer passing the further they have to go, which makes sense. It doesn’t appear to help all that much.

    Looking at the grand scheme of all teams, broken out by down

    This graph shows the first-down conversion rate for each team by down and starting position. Obviously, on 1st down, teams usually have 10 yards to go, and conversion rates are low. What's interesting is when we get into 2nd and 3rd downs, where there is a noticeably higher tendency to pass on 3rd downs, even though the distance to go is shorter.
    This graph shows the first-down conversion rate for each team by down and starting position. Obviously, on 1st down, teams usually have 10 yards to go, and conversion rates are low. What’s interesting is when we get into 2nd and 3rd downs, where there is a noticeably higher tendency to pass on 3rd downs, even though the distance to go is shorter.

    This graph shows the first-down conversion rate for each team by down and starting position. Obviously, on 1st down, teams usually have 10 yards to go, and conversion rates are low. What’s interesting is when we get into 2nd and 3rd downs, where there is a noticeably higher tendency to pass on 3rd downs, even though the distance to go is shorter.

    What this graph tells me is that teams should probably be passing more on 2nd down (not an uncommon point-of-view). Tennessee… wow – just wow. They converted less than 20% of their 4th down attempts with less than 3 yards to go on average.

    Here are the teams that pass the most, broken down by yards to go and down. This doesn't show much else, but it is interesting to see who the major passers are on each down. No surprise the air raid Washington State offense is the top of all standard.
    Here are the teams that pass the most, broken down by yards to go and down. This doesn’t show much else, but it is interesting to see who the major passers are on each down. No surprise the air raid Washington State offense is the top of all standard.

    Here are the teams that pass the most, broken down by yards to go and down. This doesn’t show much else, but it is interesting to see who the major passers are on each down. No surprise the air raid Washington State offense is the top of all standard.

    Boston College running on three-quarters of 1st down attempts seems a bit bizarre in this day and age, huh?

    This one is pretty fun. It's just yards to go vs. yards gained on each down. And it's honestly the most insane of any of the graphs, because look at LSU. They nearly averaged a 1st down on 1st downs! In my opinion, this graph is the best indicator of who the best teams are because it is showing the teams that pick up (or nearly pick up) 1st downs on each down.
    This one is pretty fun. It’s just yards to go vs. yards gained on each down. And it’s honestly the most insane of any of the graphs, because look at LSU. They nearly averaged a 1st down on 1st downs! In my opinion, this graph is the best indicator of who the best teams are because it is showing the teams that pick up (or nearly pick up) 1st downs on each down.

    This one is pretty fun. It’s just yards to go vs. yards gained on each down. And it’s honestly the most insane of any of the graphs, because look at LSU. They nearly averaged a 1st down on 1st downs! In my opinion, this graph is the best indicator of who the best teams are because it is showing the teams that pick up (or nearly pick up) 1st downs on each down.

    And look who’s at the top on 1st and 2nd downs particularly: LSU, Clemson, Alabama, and Oklahoma. As Warren Sharp always says, early-down aggressiveness is a key-factor in winning football games, and we are not seeing enough of it at present. And it doesn’t always mean just passing on early-downs (LSU passed on 57% of 1st downs, which is 22nd highest). Oklahoma only passed on 40% of 2nd downs too. Of course, it helps to just be dominant regardless of whether you run or pass, but it’s interesting. Dial up your big plays (be it a run, pass, or trick-play) on early downs and you can reap the rewards.

  • Podcast: Franklin Tailgates White Out Games, Belated Penn State HBO Viewing, Tua Out and Heisman Update + Week 9 Picks

    PSU holds off against Michigan in the White Out but struggles managing the clock, Tua is out and his Heisman hopes are getting bleak, Penn State is one of two teams to have two ranked wins, and could play FIVE ranked teams by the end of the season, Franklin is a confirmed tailgater, we give our thoughts on the Penn State Football HBO special, debate whether we’d be satisfied with a Rose Bowl bid this season, and pick a bunch of Top 25 matchups in Week 9 including Wisconsin vs. Ohio State, Notre Dame vs. Michigan, Auburn vs. LSU, and of course Penn State vs. Michigan State.

    Listen to episode 11 here.