Hey Siri, what’s the recovery rate of a surprise onside kick in CFB?
Finally, some high entertainment value from the Saturday night games. While the Miami-Clemson game got out of hand eventually, the ‘Bama-Ole Miss game was close down to almost the last play.
Some were critical of Ole Miss, in a tied game, attempting a surprise onside kick with 11:31 to go in the 4th. I personally loved it, and while I don’t have the hard stats to back it up like I would going for it on 4th down, I’m going to try to explain my argument as data-driven as I can.
First, we should just acknowledge that Alabama’s win probability didn’t move one bit after recovering that onside kick. So that play in particular was inconsequential. Now, once they scored on that resulting drive their WP went up 9% to 89%, however they were already in the mid to high 70s for most of the game, despite a tie score. I’m guessing this is because it’s Alabama and Nick Saban, and ESPN thinks they win close games against weaker opponents most of the time. The point I’m trying to make here is that despite the tied score, Ole Miss were essentially losing this game.
Second, just the reality of the game. Alabama had scored touchdowns against Ole Miss on 5 straight drives, and 6-of-8 total drives thus far in the game. 2 of these drives were 85 yards, and they would go on to have a 90 yard TD drive in the drive after the onside kick recovery drive. So field position was not the issue. Ole Miss were not stopping Alabama, and quite frankly Alabama were not stopping Ole Miss, who had scored on their last four drives, minus a 1-minute drive to end the 1st half. And the situation was doubtful to improve for either team as defenses tend to get worn out after giving up several hundred yards.
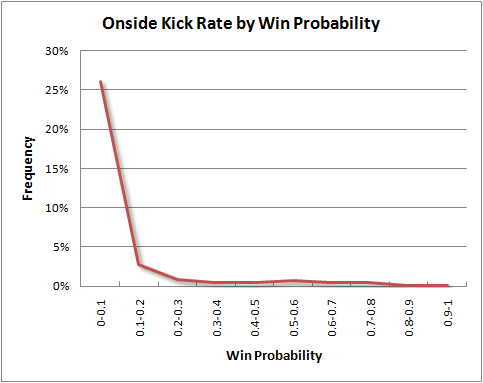
Third, and finally, is the sheer probability of recovering a surprise onside kick. Now, clearly I don’t have the data on this from college, and surprise onside kicks happen so infrequently that there probably isn’t enough good data to come up with a solid number. However, I can presume it is significantly higher than a normal onside kick where 11 guys on the receiving team are waiting for your 11 guys, vs. 4 or 5 guys in-range reacting to your 11 guys who know the plan. I actually stumbled upon an interesting article by Brian Burke from 11 years ago that talks about this in the NFL. The first point is probably obvious: teams most often attempt onside kicks when the game is essentially out of reach. The below graphs are credit Brian Burke and his article.
Teams use onside kicks most often when win probability is extremely low. Credit Brian Burke.
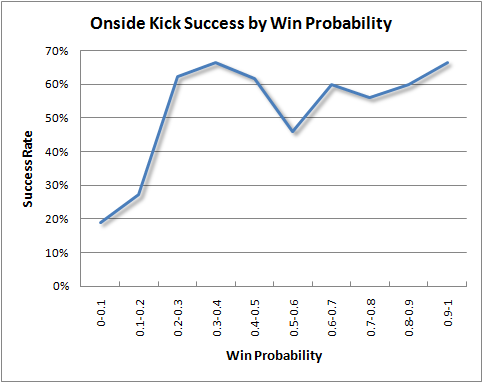
His second graph is more interesting and less immediately knowable by watching games. The recovery rate basedon a team’s win probability.
Onside kicks are much more successful when the game has not been definitively decided yet. Credit Brian Burke.
Now this is NFL pre-onside kick rule changes (so similar to how college rules still are today). The 19% recovery rate when a team has WP of ~1% is pretty much in line with what the league averages were back then. This makes sense since, as the first plot shows, most onside kick attempts are made out of desperation. But as soon as you have even a 20%-30% chance of winning (Ole-Miss’s exact scenario), the recovery rates of onside kicks shoot way up to 60%! Regardless of formation, we can consider these attempts as “surprise” onside kicks, because it is inherently surprising for a team to do an onside kick when they are still well in the game, or if there’s a lot of time on the clock.
So is it worth it? A 60% recovery rate sounds great, but what does a 40% failure rate do to you on defense with a short field? Well, based on EPA, Brian determined that a successful onside kick was worth 1.2 expected points, a failed onside kick was -2.1 expected points, and your normal kickoff is already worth -0.7 expected points. So a failed onside kick is 1.4 expected points worse than the normal kickoff. Using some basic algebra, he calculated that you would need a 42% success rate for your onside kicks for it to be worth it in expected points. So, given the plot above, we’d say that it was definitely worth a shot because on average, the 60% recovery rate will net you positive expected points.
Exploratory Data Visualizations of First Down Rate, Average Yards to Go, and Passing Rate by Down
Like most of you, I am finding myself realizing that there is not much to do when you can’t make “plans”, per se. I decided to try to use some of my time productively this past weekend by messing around with some college football data (courtesy of @CFB_Data). The results paint an interesting picture about individual teams (just how good LSU was in 2019; just how much Maryland struggled on 4th downs), as well as overall trends in college football playcalling.
So let’s just dive right into it. I won’t get into too much detail other than sharing my takeaways from some of these graphs. They’re not gamechanging, but they’re interesting to look at.
Looking at individual teams on 3rd and 4th downs
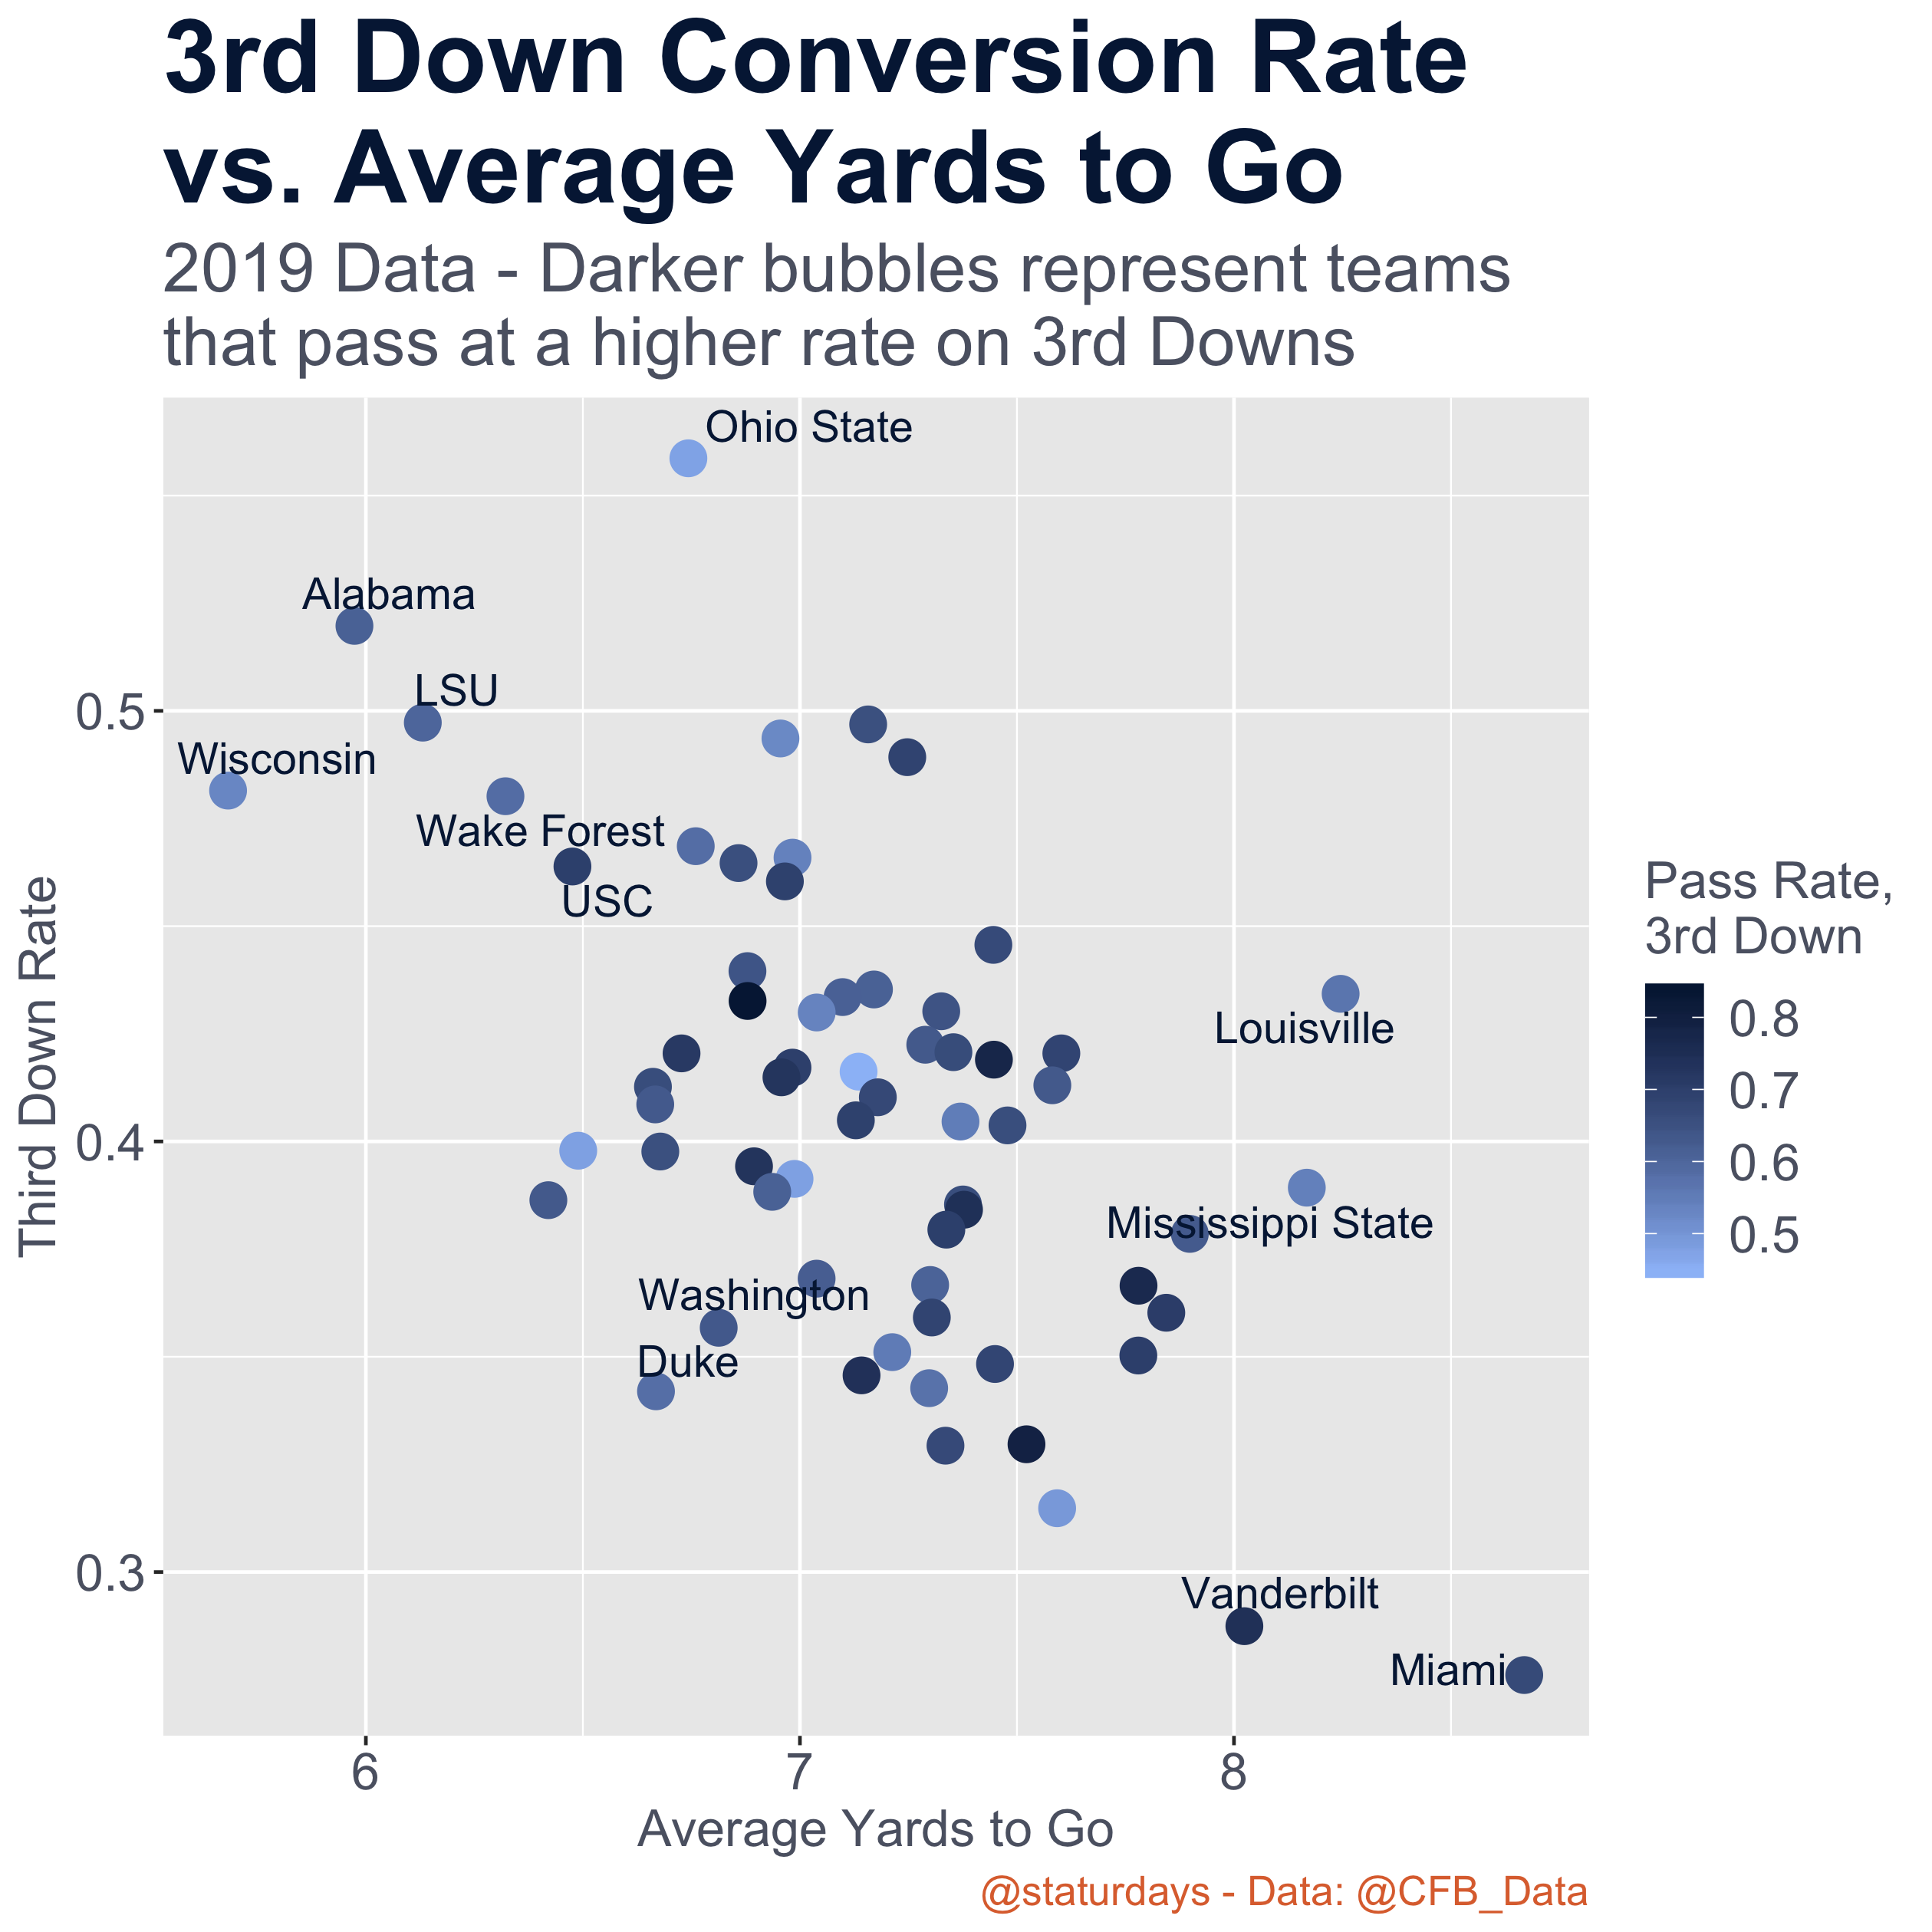
Intuitively, you see that the less yards teams have to-go on 3rd downs, the higher their conversion percentage. However, there are some interesting exceptions. Ohio State outperformed their counterparts.
Intuitively, you see that the less yards teams have to-go on 3rd downs, the higher their conversion percentage. However, there are some interesting exceptions. Ohio State outperformed their counterparts with the highest 3rd down conversion rate in the Power 5 at .552. Wisconsin, Alabama, and LSU were experts at getting in 3rd and short situations.
It doesn’t look like being pass-heavy on 3rd downs really favors or disadvantages you based on the graph – the darker bubbles (pass-heavy teams) are fairly spread out high and low on the graph.
Despite regularly being in 3rd and long situations, Mississippi State and Louisville actually outperformed many of their counterparts with shorter distances to go on average, namely Duke and Washington.
4th down conversion rates and yards to go were all over the place, as expected. But some teams converted at a very high rate, like Alabama, Wisconsin, UNC, and VT.
4th down conversion rates and yards to go were all over the place, as expected. But some teams converted at a very high rate, like Alabama, Wisconsin, UNC, and VT. Some did not fair so well, like Tennessee, Texas, Stanford, and Maryland.
It looks like teams prefer passing the further they have to go, which makes sense. It doesn’t appear to help all that much.
Looking at the grand scheme of all teams, broken out by down
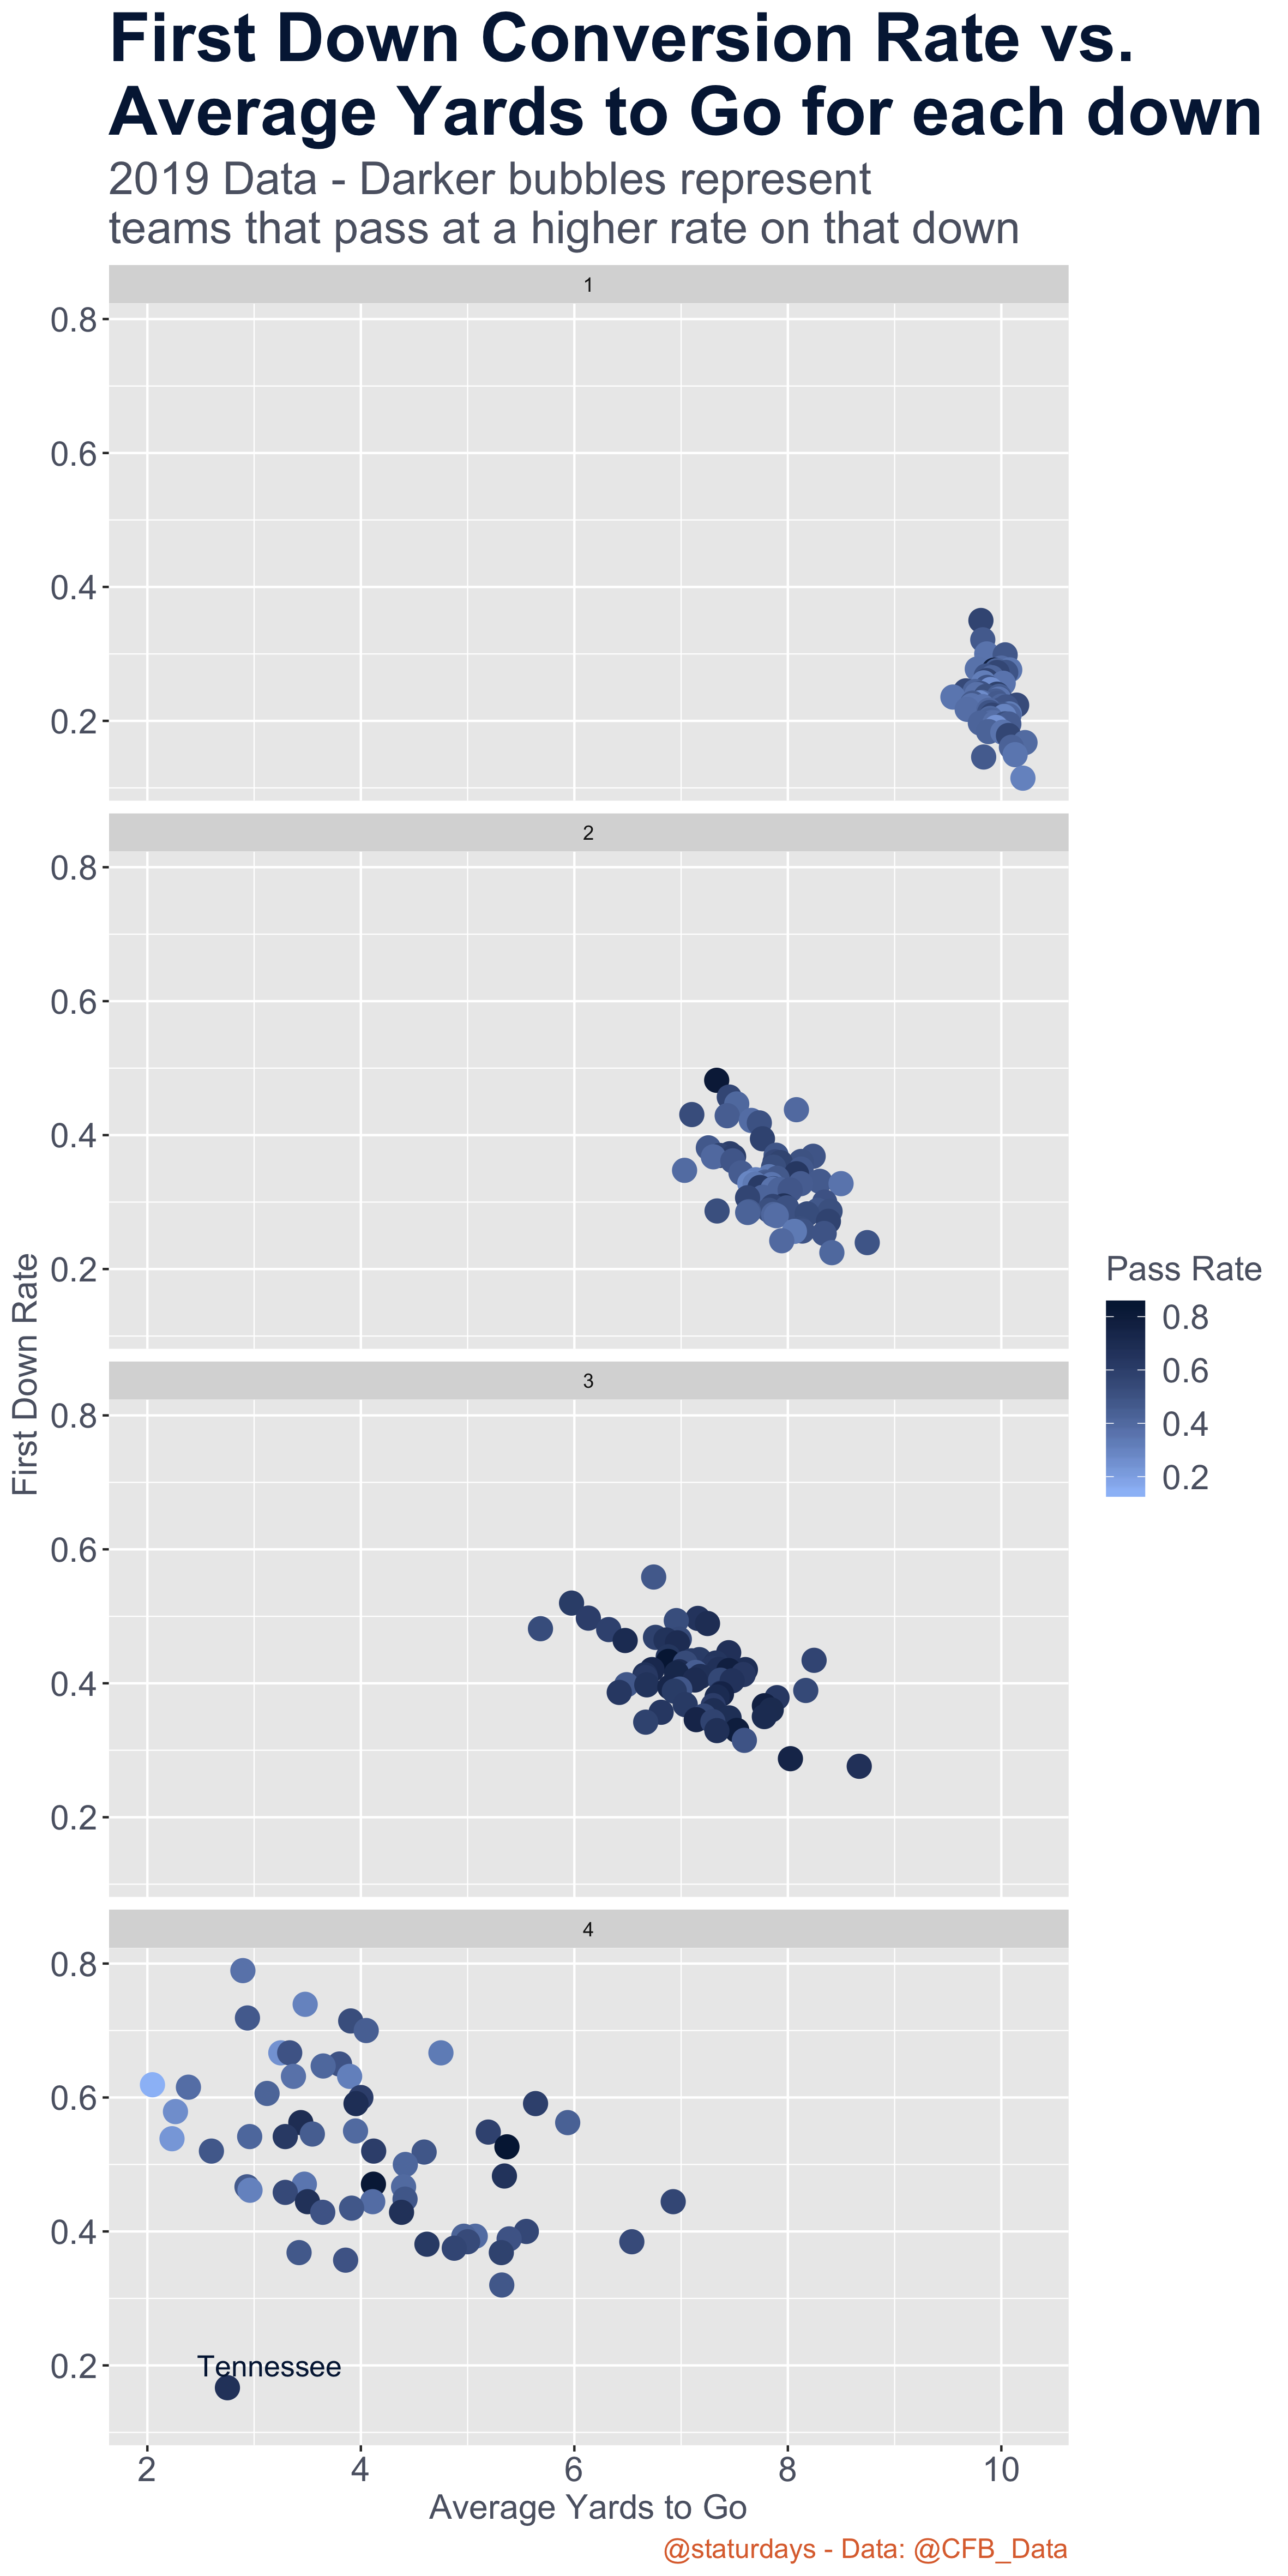
This graph shows the first-down conversion rate for each team by down and starting position. Obviously, on 1st down, teams usually have 10 yards to go, and conversion rates are low. What’s interesting is when we get into 2nd and 3rd downs, where there is a noticeably higher tendency to pass on 3rd downs, even though the distance to go is shorter.
This graph shows the first-down conversion rate for each team by down and starting position. Obviously, on 1st down, teams usually have 10 yards to go, and conversion rates are low. What’s interesting is when we get into 2nd and 3rd downs, where there is a noticeably higher tendency to pass on 3rd downs, even though the distance to go is shorter.
What this graph tells me is that teams should probably be passing more on 2nd down (not an uncommon point-of-view). Tennessee… wow – just wow. They converted less than 20% of their 4th down attempts with less than 3 yards to go on average.
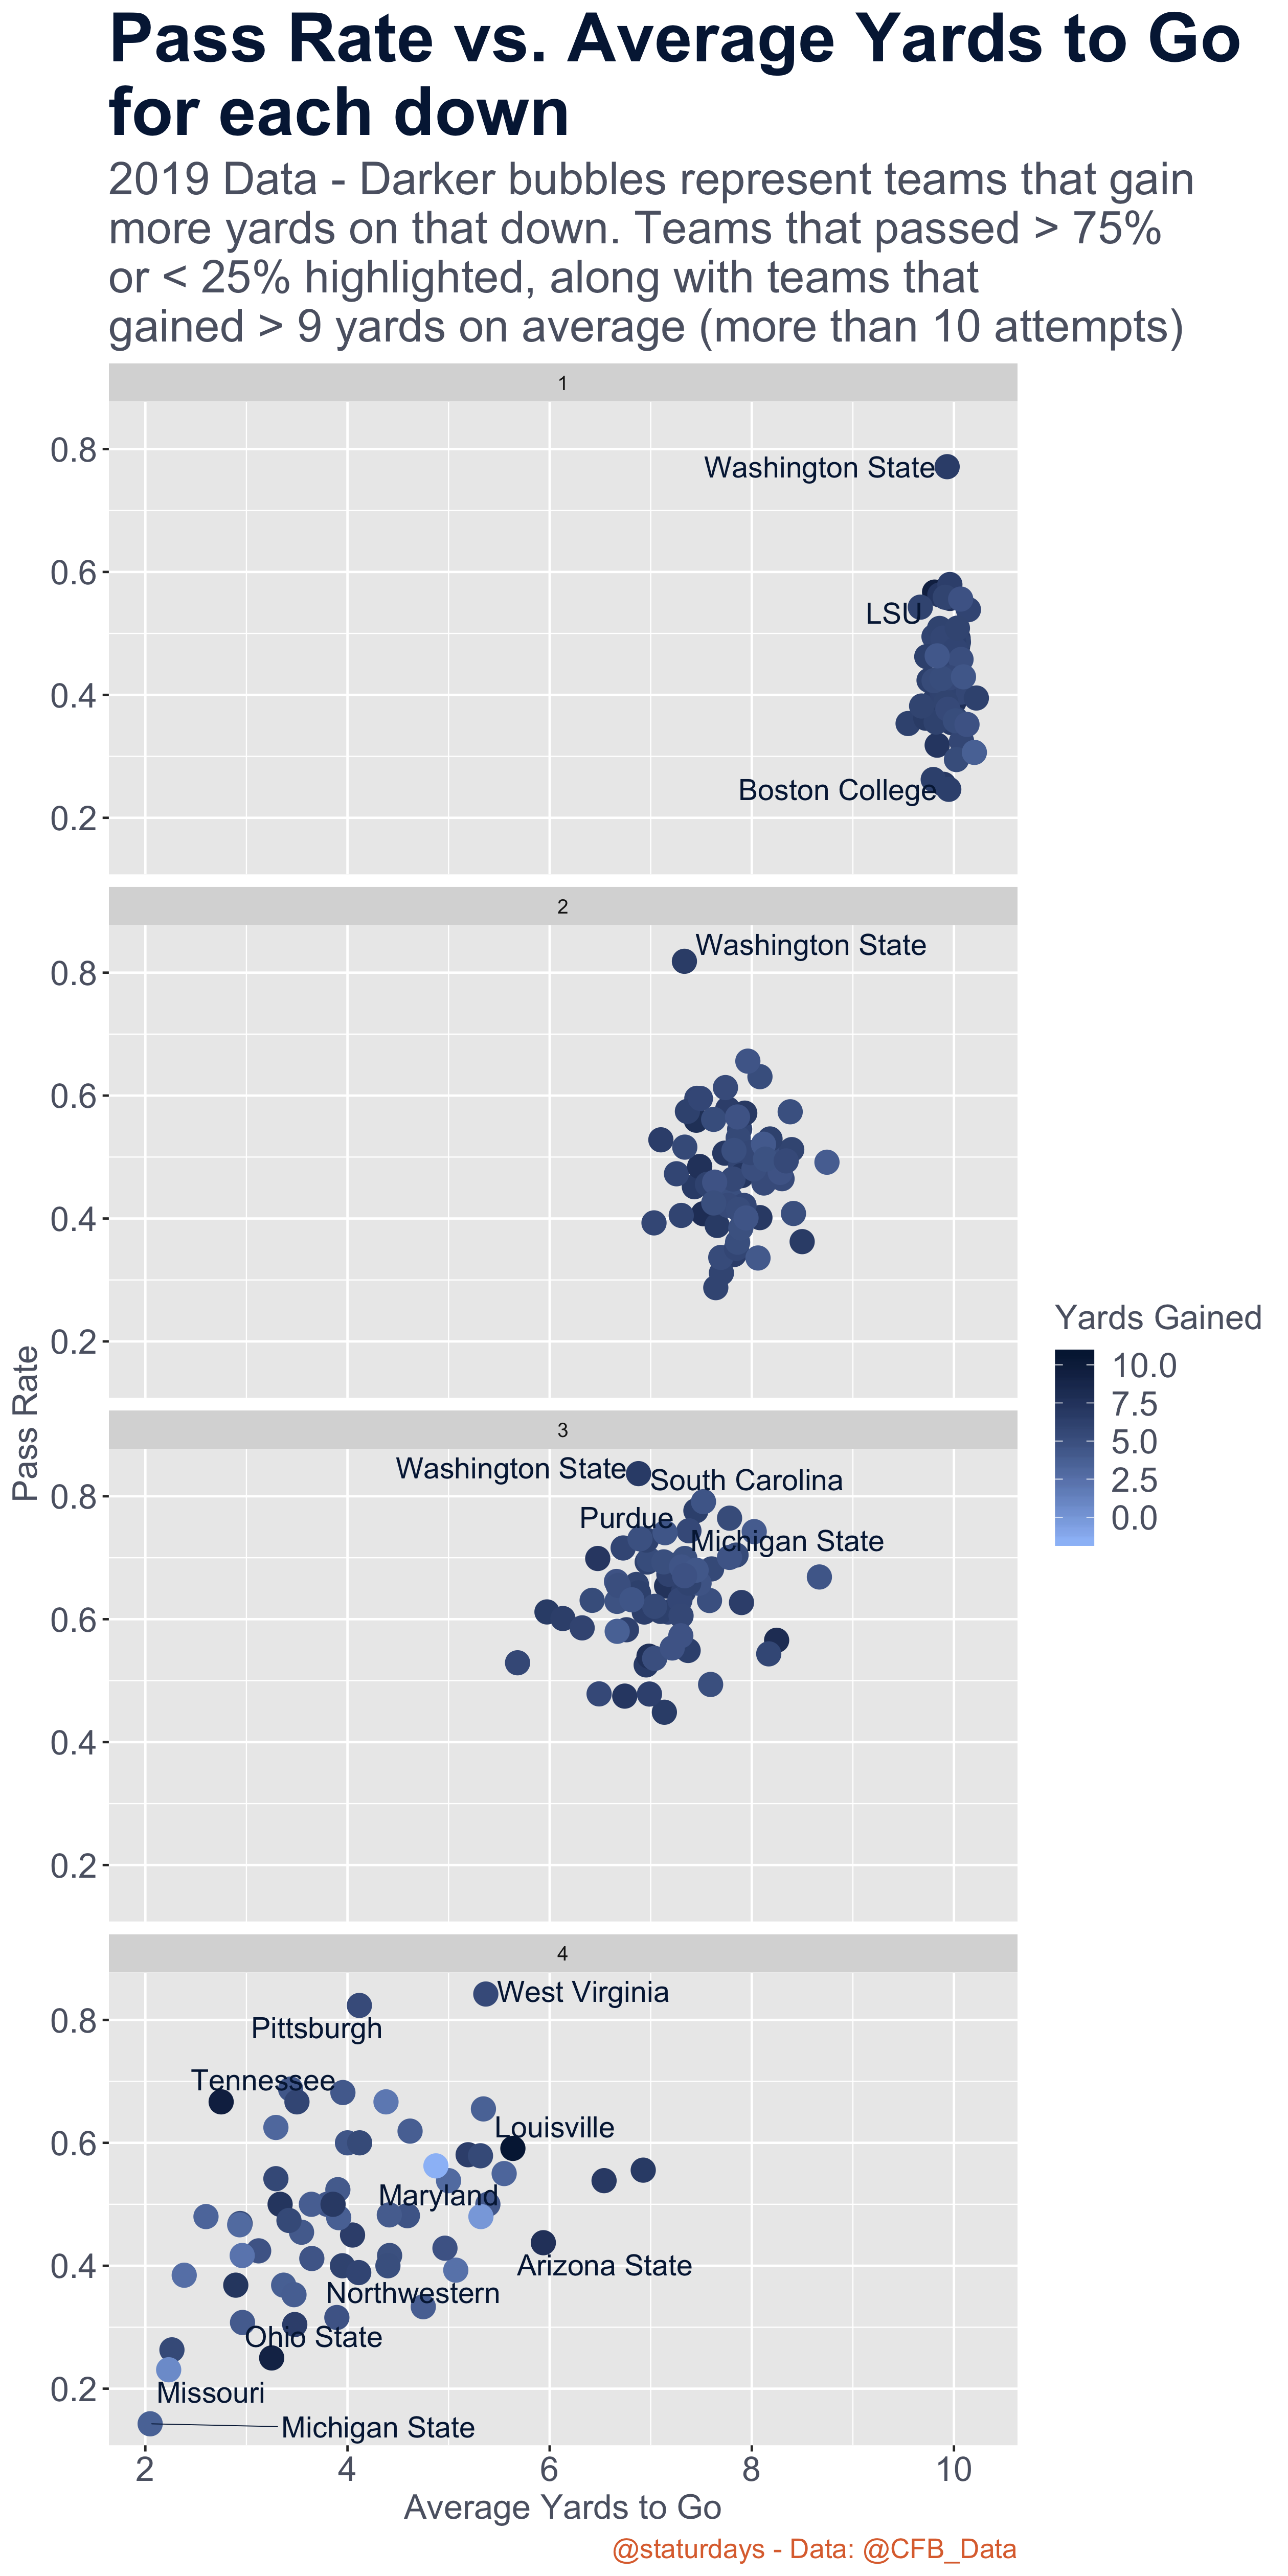
Here are the teams that pass the most, broken down by yards to go and down. This doesn’t show much else, but it is interesting to see who the major passers are on each down. No surprise the air raid Washington State offense is the top of all standard.
Here are the teams that pass the most, broken down by yards to go and down. This doesn’t show much else, but it is interesting to see who the major passers are on each down. No surprise the air raid Washington State offense is the top of all standard.
Boston College running on three-quarters of 1st down attempts seems a bit bizarre in this day and age, huh?
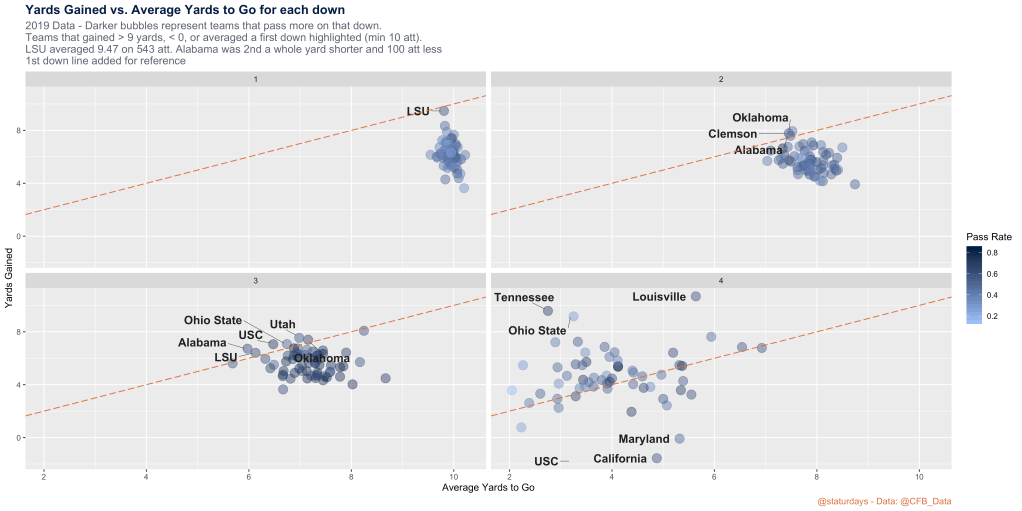
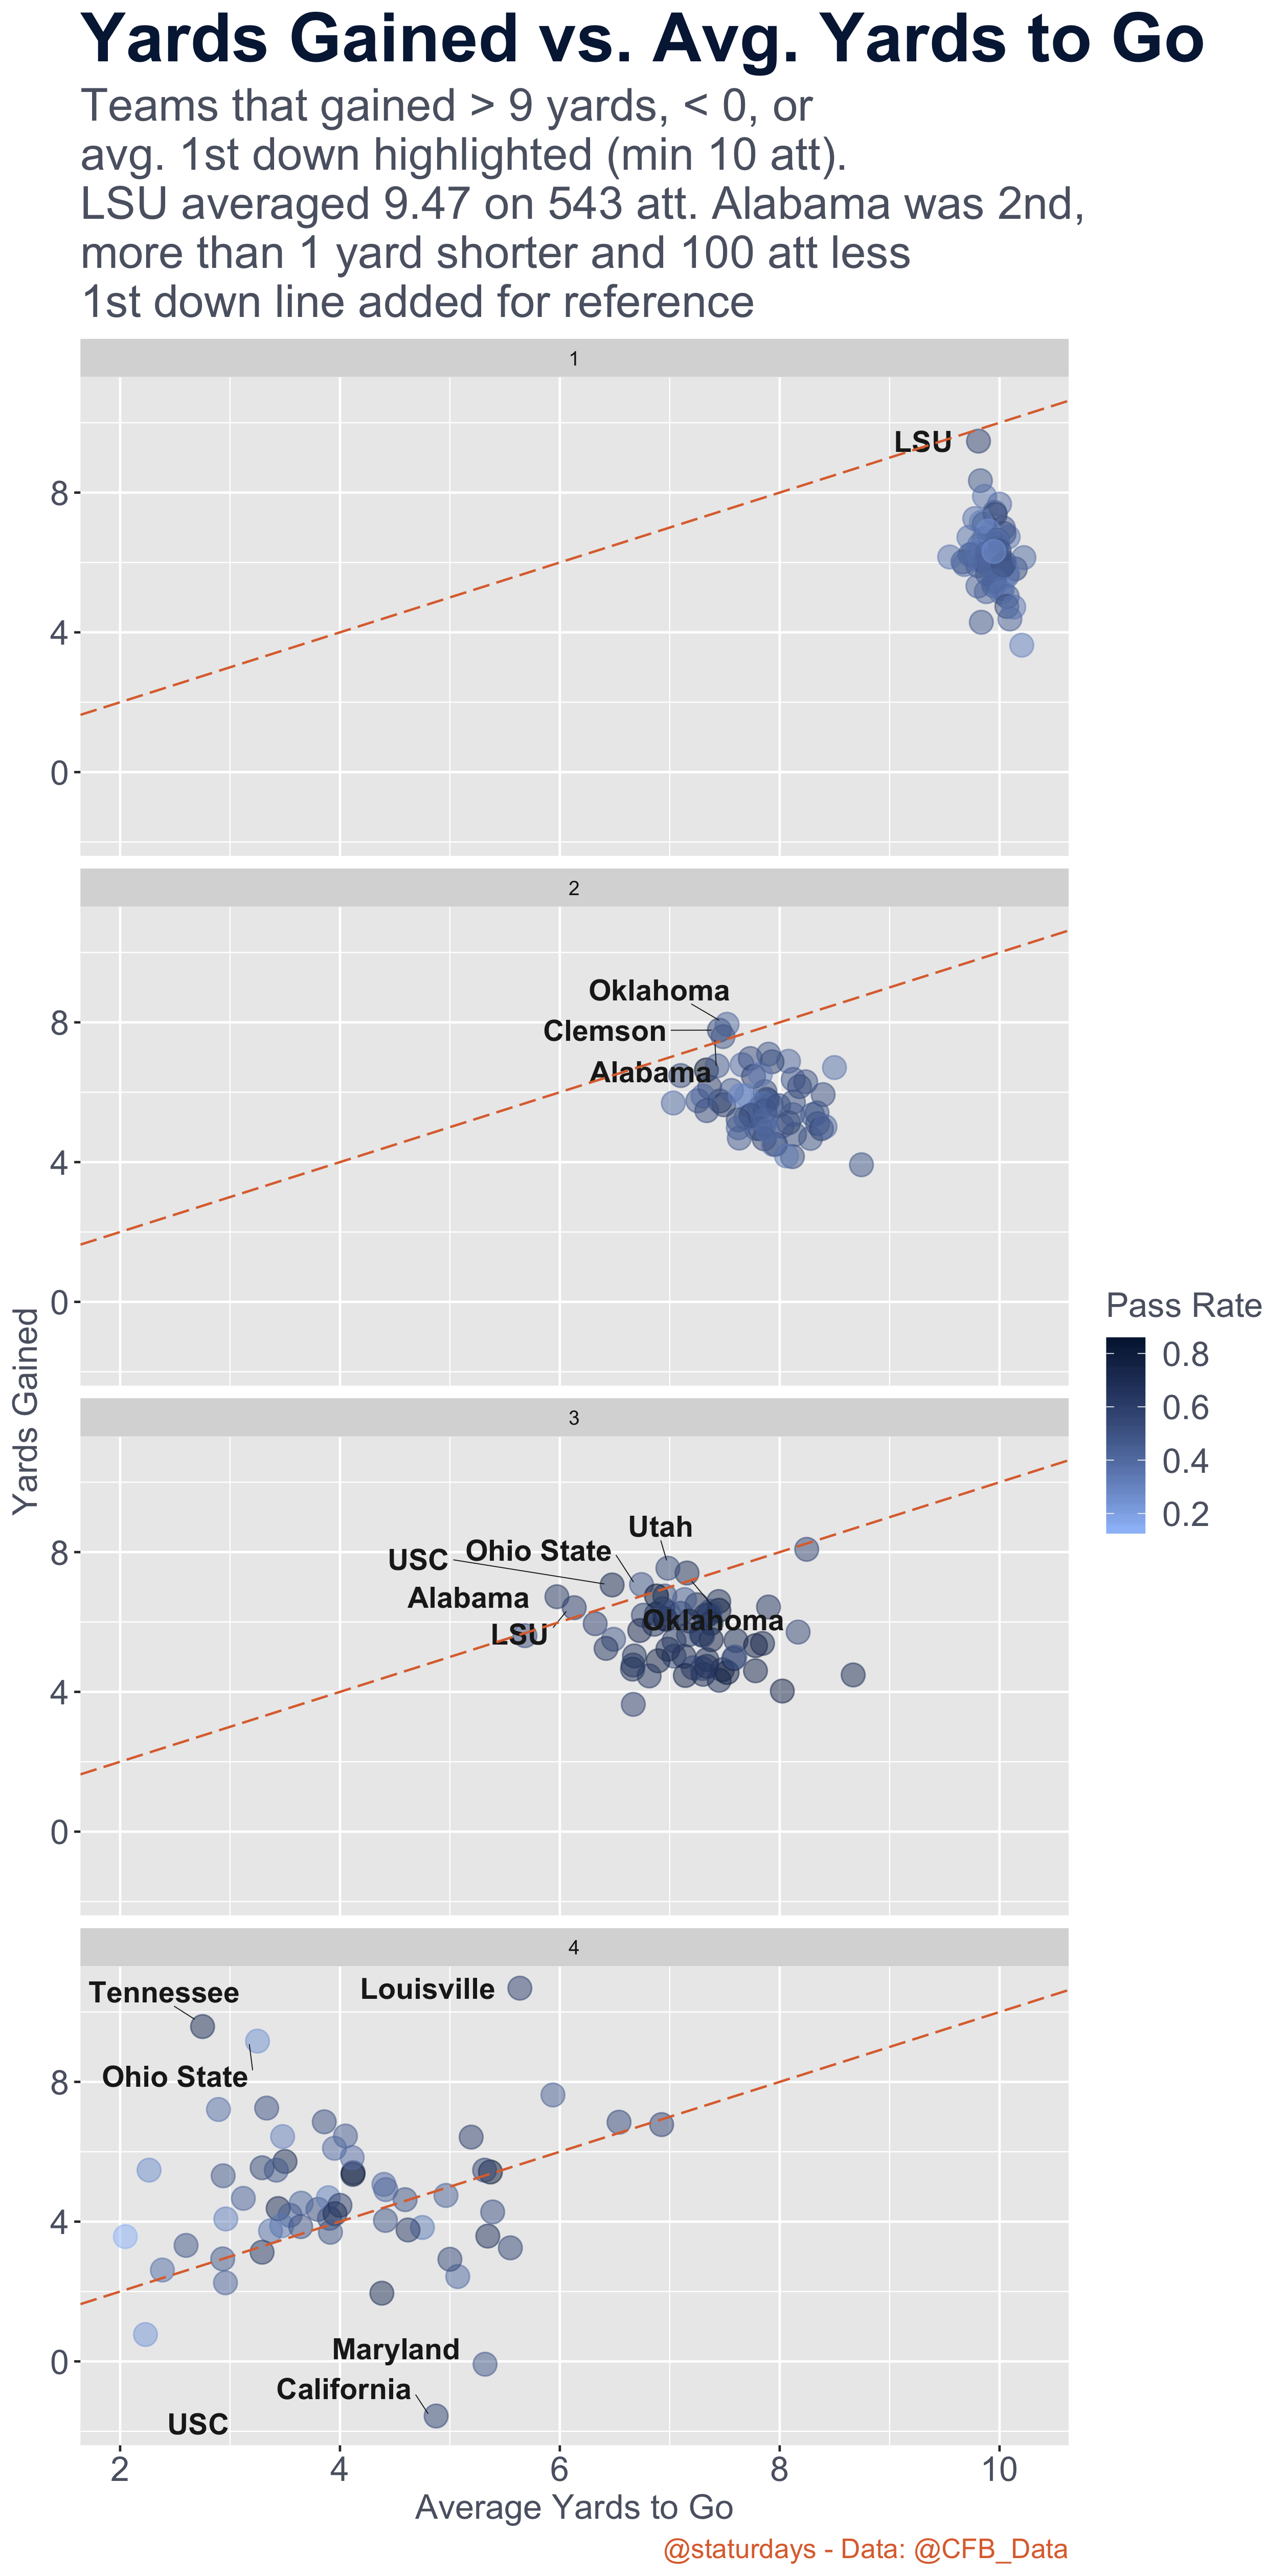
This one is pretty fun. It’s just yards to go vs. yards gained on each down. And it’s honestly the most insane of any of the graphs, because look at LSU. They nearly averaged a 1st down on 1st downs! In my opinion, this graph is the best indicator of who the best teams are because it is showing the teams that pick up (or nearly pick up) 1st downs on each down.
This one is pretty fun. It’s just yards to go vs. yards gained on each down. And it’s honestly the most insane of any of the graphs, because look at LSU. They nearly averaged a 1st down on 1st downs! In my opinion, this graph is the best indicator of who the best teams are because it is showing the teams that pick up (or nearly pick up) 1st downs on each down.
And look who’s at the top on 1st and 2nd downs particularly: LSU, Clemson, Alabama, and Oklahoma. As Warren Sharp always says, early-down aggressiveness is a key-factor in winning football games, and we are not seeing enough of it at present. And it doesn’t always mean just passing on early-downs (LSU passed on 57% of 1st downs, which is 22nd highest). Oklahoma only passed on 40% of 2nd downs too. Of course, it helps to just be dominant regardless of whether you run or pass, but it’s interesting. Dial up your big plays (be it a run, pass, or trick-play) on early downs and you can reap the rewards.
Finally, football is back. After an earlier-than-expected playoff bid scare for Penn State, our heart rates have collectively settled and we can get back to the business of what has become an annual tradition of crushing Pitt (2016 excluded. Wiping it from my memory).
The other week I talked about Trace McSorley’s upcoming Heisman campaign, but I also talked about the defensive efficiency of each conference. This week, with the college football season in full swing, I’m going to take a look at the offensive side of the ball. We’ll also find out who is the most balanced on both sides. This data is from the 2017 season, so keep checking back here as I will be updating these rankings for each week of the 2018 season.
Now, Big Ten fans: shield your eyes. This one isn’t pretty. When I found the offensive efficiency scores of every team and averaged them out by conference, the Big 10 was dead last. Make sure to check the appendix at the bottom to see in detail where these stats came from.
Worst Offensive Conferences in College Football?
The Big 10 has 11 and 8 teams below the mean offensive efficiency score for the FBS (my version of the FBS – the Power 5 conferences and the American) on offense and defense respectively, where the PAC 12 has 8 teams above the mean on both offense and defense, which leaves only 4 teams under the mean. The Big 10 particularly struggles on offense. Intuitively this would make sense if the Big 10 is the strongest defensive conference; you would expect their offenses to struggle with tougher opposition. However, with the new version of defensive efficiency or DAD’s, the PAC 12 is actually the conference with the highest average ranking on defense too!
So now I’m really thrown off. The Big 10 is actually just the 2nd best defense, and their offense is last by a mile. So what’s going on? The Big 10 is brought down by a lot of teams being under the mean, but also by a few outliers that are dramatically worse at offense than the rest of college football. Illinois falls 2 standard deviations below the average, and Rutgers is close behind (ahead? Not sure how to phrase this) at 1.93 standard deviations, also known as the bottom two teams in college football in offensive production. You could’ve guessed this if you watched any of their games: they combined for a hard-to-watch 15 passing touchdowns last year, each with a completion percentage under .500. On the other side of the ball, Nebraska is also 1.8 standard deviations below the mean on defense. The Pac 12 doesn’t have as drastic of outliers. The standard deviation for each conference backs this up. The Big 10 is the 2nd most spread out conference on offense behind the Big 12, while the Pac 12 has the lowest standard deviation, meaning all of their offenses are similarly balanced.
The average Z score for offenses and defenses of each conference
Most balanced teams
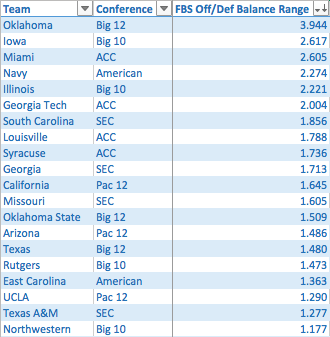
To figure out who the most balanced teams were on both sides of the ball, I took the Z score of their offense and subtracted it from the Z score of the defense to find the range, then took the absolute value so they were all positive. This results in what I’m calling Offensive/Defensive Balance. A low score is *sometimes better (note: a team can be balanced by being great on offense and defense, but they can also be equally crappy on both sides of the ball). So who were the most balanced teams? Well, bad news Penn Staters:
The most balanced teams in the FBS
The good news is, as indicated by red, Pittsburgh (and others) are the bad kind of balanced, meaning both their offense and defense are equally bad (within .001 for Pitt), which is an accomplishment in itself. Notice that Clemson and ‘Bama come in at number 3 and number 17 (the good kind of balanced). Penn State is down at number 29: just about average. Now for the bottom 20:
The least balanced teams in the FBS
Now, this one isn’t color coded because it’s all bad. And who’s on top, none other than Oklahoma straight outta the “defense optional” Big 12. Also rounding out the top 10 is Georgia, who beat the slightly more unbalanced Oklahoma but went on to lose to the much more balanced Alabama. Now anybody who watched that game knows it was Georgia who looked the better team for most of it, so I’m not saying that balance wins games. But, it is an interesting trend and definitely looks like it pays off down the stretch to have strength on both sides of the ball. For you Eagles fans, think how vital it was to have that wild-dog defense in the playoffs when the offense sputtered against the Falcons. And then how key it was to have the offense pick up the slack when Tom Brady tried (and failed) to play receiver.
Offensive Powerhouses
The top of this one should come as no surprise:
The top 20 teams on offense
What is a bit surprising is lower down the list. Navy, a rushing powerhouse, sneaks in at #13. They are right above Wake Forest, an underrated team in the ACC. Clemson and Washington show up a bit lower than we’d expect, but they make up for it in having really balanced teams as we saw above. We’ll have to see how the ACC looks this year as the season progresses. Virginia Tech, who came in at #39 for 2017, looked pretty good against Florida State.
Also need to shout out PSU for being #9 in the FBS. Anybody that lived through the Hackenberg years knows that our current offense is looks about as different as possible from the one John Donovan and guys before him ran. When I look back on those years, I think of grey clouds, muddy fields, and WR screens being thrown into the dirt. Now I think of sunny skies and T-McSorley guns-out, heaving bombs that only our guys can get to. We’ve come a long way.
Best all-around teams
So who are the best overall teams, determined by summing up each team’s offensive and defensive Z scores? Penn Staters can finally rejoice for once during this article. Here’s the top 20:
The top 20 teams on offense and defense in the FBS
Surprisingly, the least represented conference here is the SEC, followed by the Big 10. Penn State comes in at a solid #6, right next to their Big 10 East rivals “The” Ohio State. UCF and Memphis are helped by their inflated numbers by playing some truly god-awful teams. I talked about unbalance in the Big 10 with Rutgers and Illinois… well the American conference has two even worse teams in East Carolina and Cincinnati, both 2 standard deviations below the FBS mean total team Z score. UConn is also 1.7 standard deviations below average. They’re reflected in the bottom 20:
The bottom 20 teams on offense and defense in the FBS
The Big 10 isn’t as good as people say it is
I mean, seriously, look how many Big 10 teams are in the bottom 20. SEVEN! Some of them you expect, but Michigan has seriously got to pick up the slack. They were plagued by seriously bad quarterback play this past year (9 passing TD’s, 10 INT’s). Hopefully it gets better for all of our sakes.
This paints a different picture than what you will hear in the media: that the Big 10 is the strongest conference out there; they may be ONE of the strongest defensively, but overall having half of your conference in the bottom 20 of teams is not a good look. I think the Big 10 gets its reputation from its low scoring games (in part due to good defense, in larger part due to bad offense), which football savants respect as “better, hard-nosed, how-the-game-is-meant-to-be-played” football. In reality, it’s PSU, OSU, and Wisconsin that are lifting up the conference. Now, these are 2017 numbers. Like I said, I’ll be updating this as the 2018 season goes on. Hopefully some influx of new talent and quality coaches will start to see a shift. We already have some hope with Maryland taking down Texas yet again in their season opener. Should we Penn State fans start to *gasp*… root for Rutgers and Maryland to get better? Time will tell.
Appendix
Here is a list of the stats I used to find offensive and defensive efficiency ratings, as well as explanations for other metrics that I reference:
Offensive Efficiency Score Per Game
This is similar to the QB score I had last week, except at a team level. It looks at the following stats (if it is scaled that is in parentheses):
First Downs
Penalty Yds (-1)
Pass Yards
Completion Pct
Pass TD (7)
INT (-4.35)
Sacks
Rush Yards
Rushing Yards Per Attempt
Rush TD (7)
FG Made (3)
FG Pct
XP Made
XP Pct
It is summed up for the season and divided by the number of games that the team played, to control for different season lengths.
Defensive Efficiency – DADs Per Game
Defensive Actions Distressing QB’s, the stat you know and love from my last article, is back and better than ever. It is now improved to provide a raw score rather than just comparing conferences to the top conference. I also calculated it for every team individually instead of on a conference level. Once again, controlled for games played. Stats included with scales in parentheses are:
Total Tackles (0.1)
Sacks
Passes Defensed
Interceptions (4.35)
Fumbles Recovered (4.65)
I will continue to tweak this as the season goes on to include more variables like yards allowed, points allowed, etc. Right now this is all ESPN offers.
Converting Raw Scores to Z Scores
In order to be able to add, subtract, and otherwise compare these offensive and defensive efficiency scores, they have to be standardized. This is because the average offensive score per game was 408 while the average defensive score per game was 19.5. To compensate for this, I used a Z score. This takes each raw score, subtracts the average score of the entire FBS from it (so 408 or 19.5), and then divides that by the standard deviation of the FBS scores. This normalizes the scale so that the most average team will have a score of 0. The entire league will be distributed on a normal curve with a mean of 0 and a standard deviation of 1. Now, we can add a team’s defense that scores a 1 (meaning 1 standard deviation above the average team) and their offense that scores a -2 (meaning 2 standard deviations below the average team) to say that their total team Z score is a -1.
Off/Def Balance
Takes the absolute value of the range of offensive and defensive Z scores. This tells you who is the most balanced between offense or defense. Low score is *sometimes better (note: a team can be balanced by being great on offense and defense, but they can also be equally crappy on both sides of the ball).
Team Total Z Score
Sum of offensive and defensive Z scores. Tells you who is the best on both sides of the ball. Higher is better, meaning they are above the mean on both offense and defense.