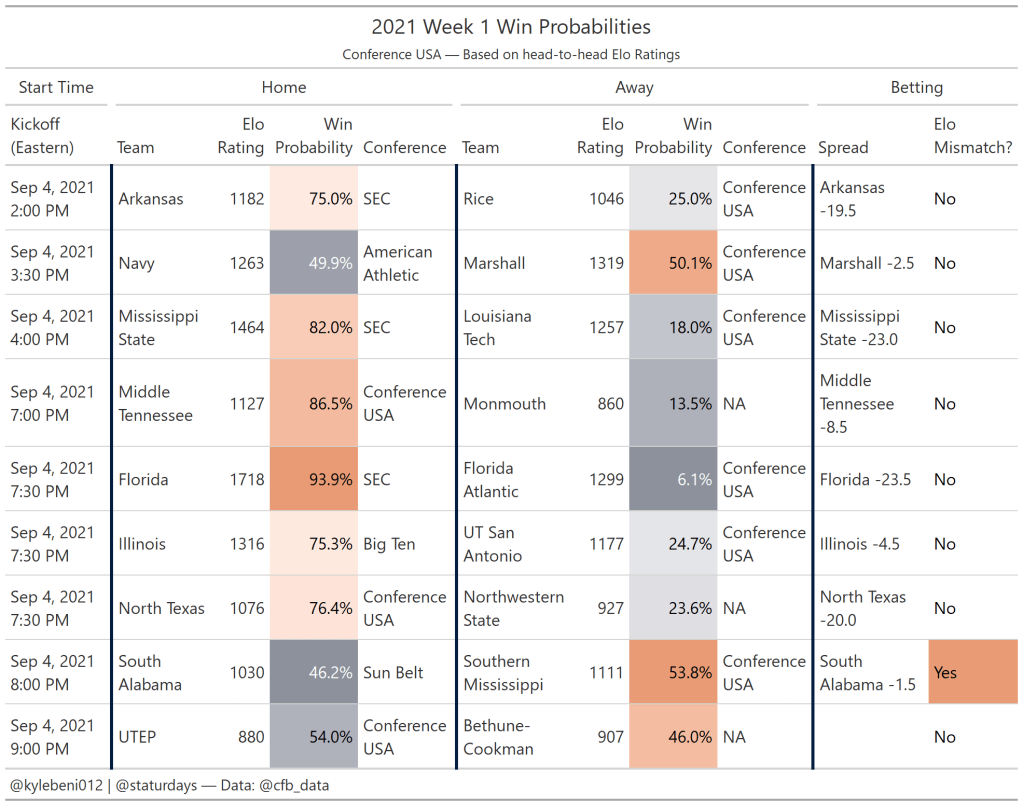
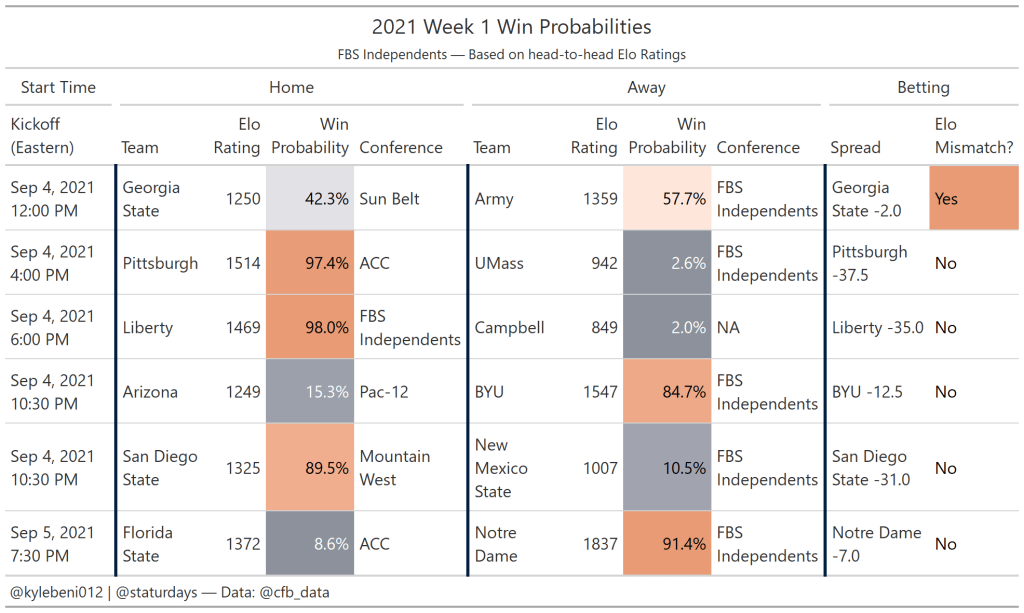
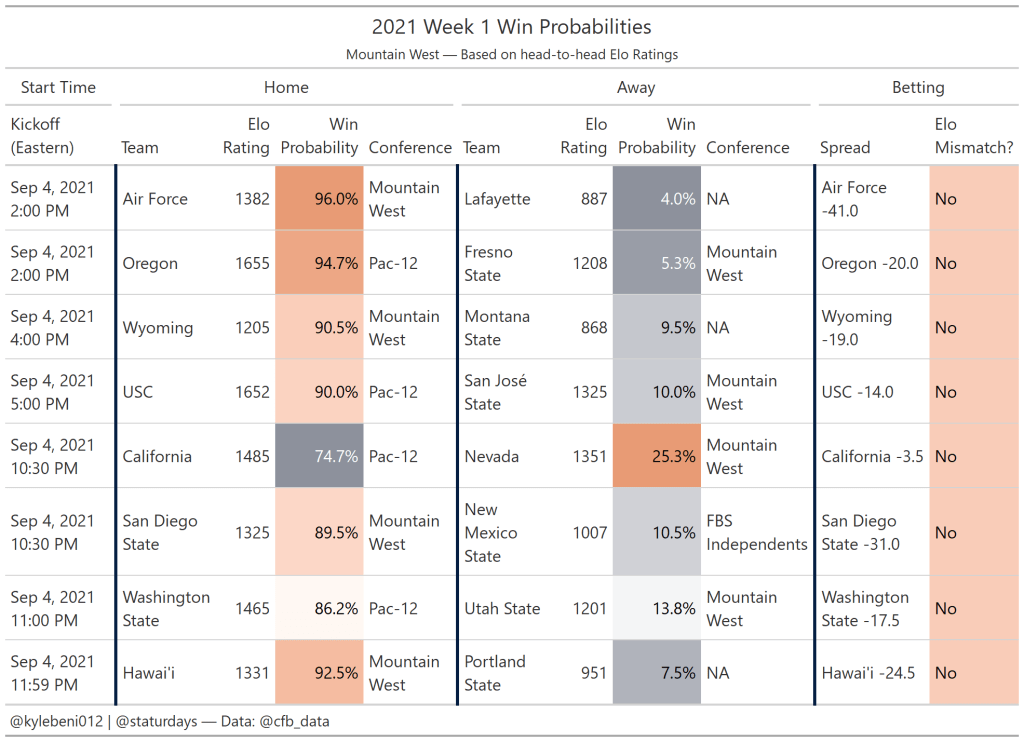
Sports

  • 2021 Preseason Elo Ratings

    2021 Preseason Elo Ratings

    It’s finally here: the 2021 College Football season. We’ve been waiting for a long 7 months for the return to a full schedule, and hopefully a sense of normalcy with fans back in the stands.

    And a new season means the return of our Elo ratings, a point-based rating system originating from chess and now being applied across a wide range of sports, where you gain or lose points based on your wins and losses over the expectation. So if you win games that your Elo rating suggested you would lose (think Appalachian State over Michigan), you’ll shoot up the rankings much faster than if you win games you were always expected to win.

    So without further ado, here are our 2021 preseason Elo ratings for the Top 25 teams.

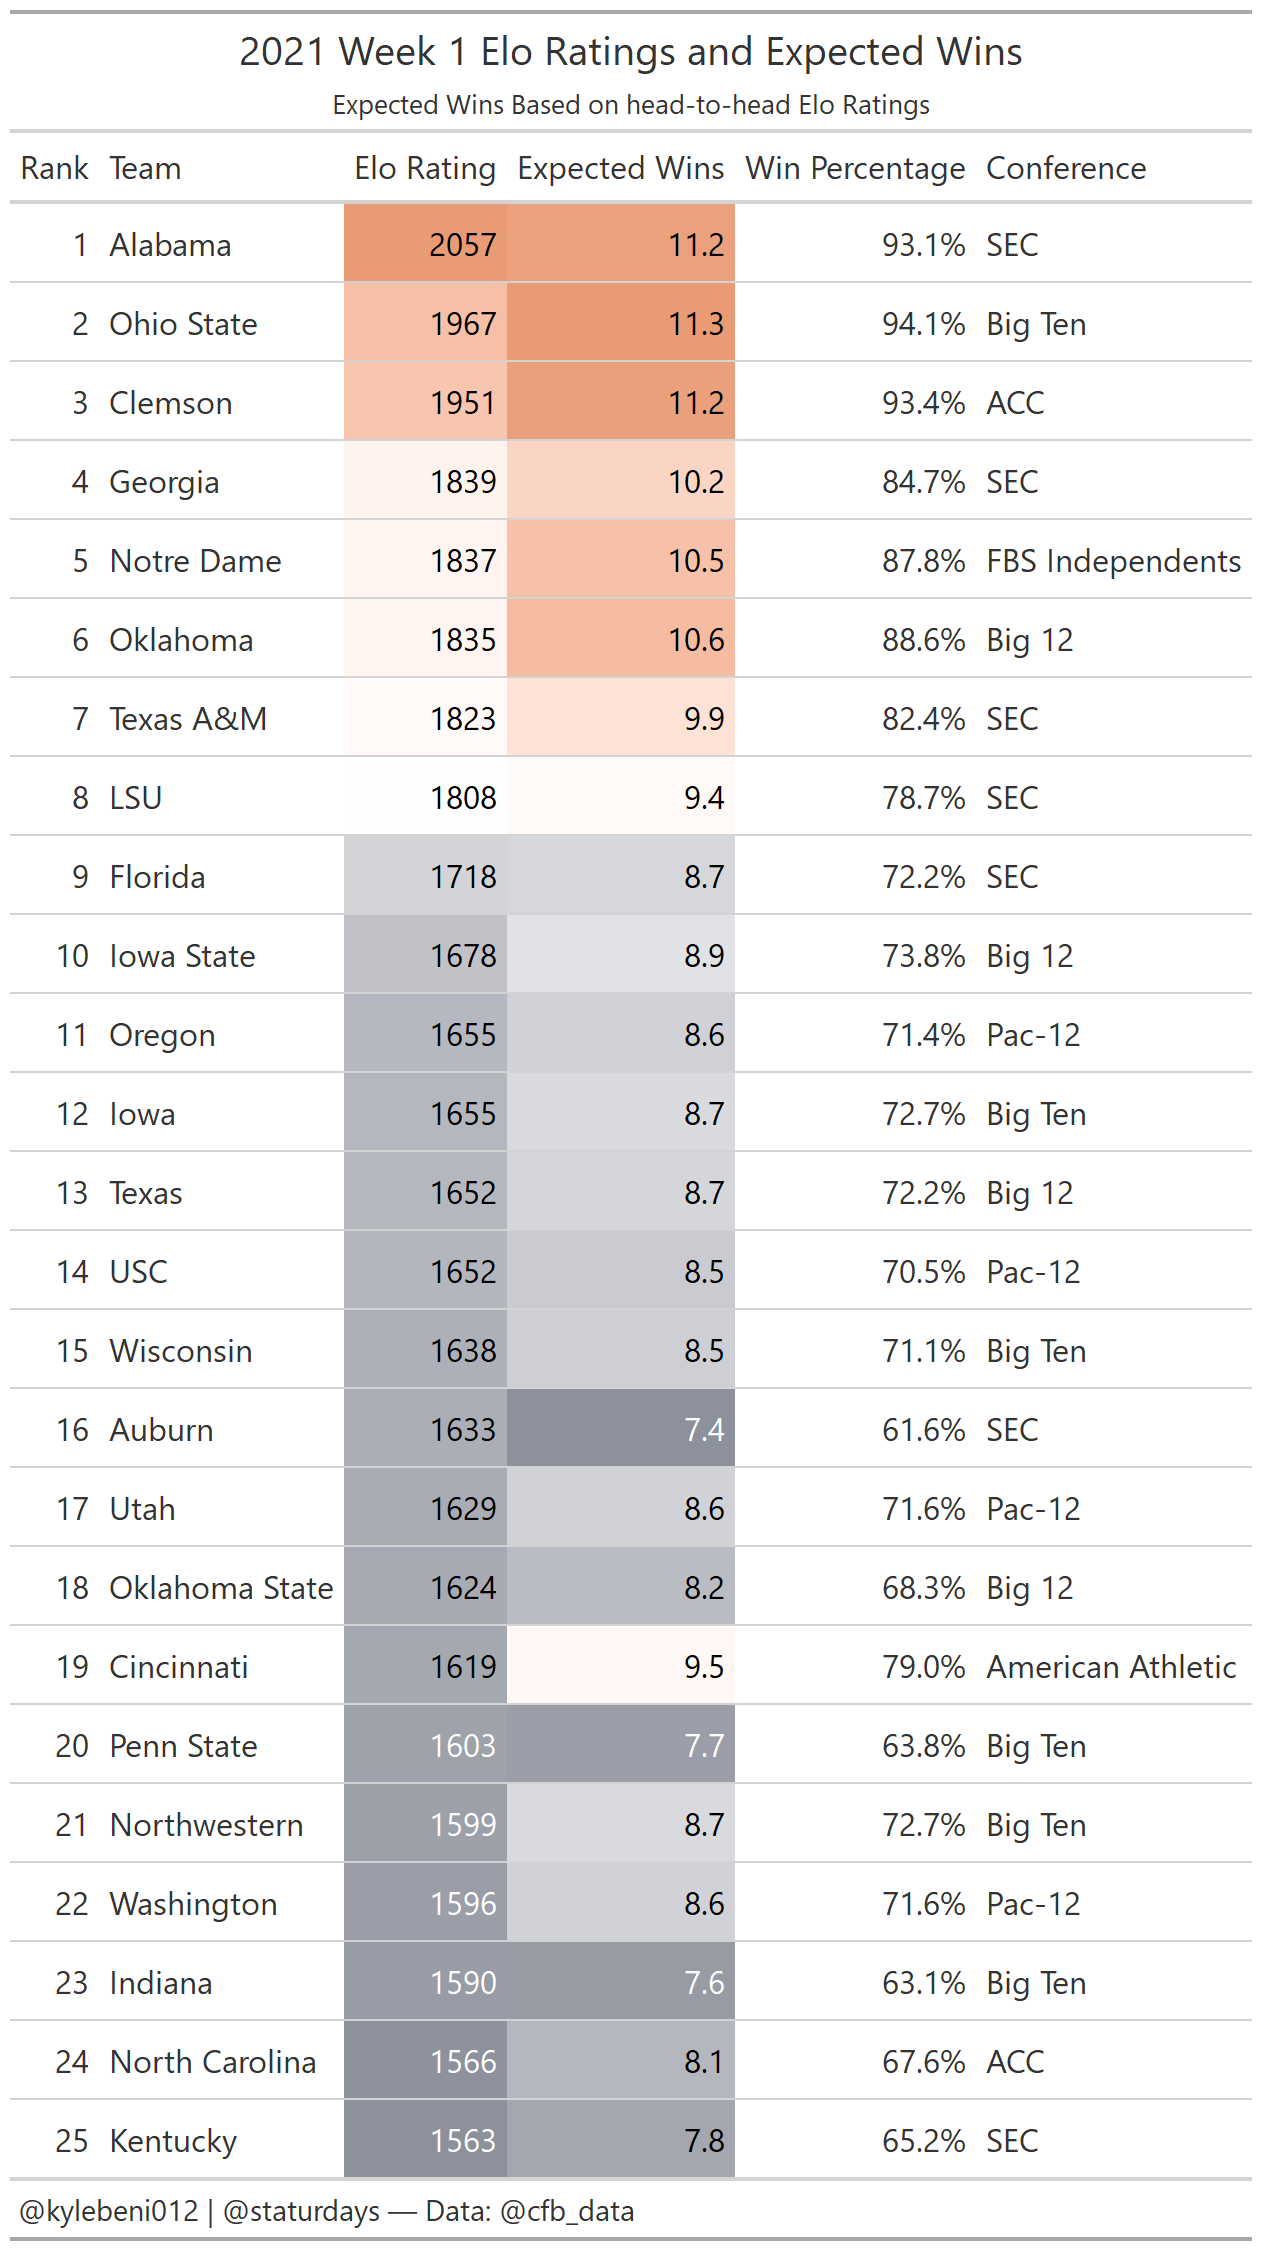
    As expected, the 2020 National Champion Alabama team sits atop the rankings. This is because the Elo rating system discounts every team equally (within the Power 5 conferences) during the offseason, meaning that every team’s starting rating at the beginning of the 2021 season is 5% less than at the end of the 2020 season.

    However there are still some names to get excited about, and teams that haven’t typically cracked the preseason top 25 sitting up there like Kentucky, Indiana, and Northwestern.

    In total, there are 7 SEC teams, 6 Big Ten teams, 4 Big-12 teams, 4 Pac-12 teams, and 2 ACC teams plus Notre Dame who competed in the ACC last season.

    You can check out the full ratings for all Division I teams below. We’ll update these ratings weekly to track the biggest movers as the season progresses.

    Full Rankings

  • Season Simulations for all Power 5 Conference Teams

    Season Simulations for all Power 5 Conference Teams

    Using our Elo ratings, which serve as a measure of each team’s strength and update after each game, we simulated the upcoming college football season 10,000 times. This was done for every matchup for every team across the sport, and we’ve separated out the result for each Power 5 conference below. Using our Elo ratings, we simulate the outcome of each game over and over as we progress through 10,000 hypothetical seasons. At the end of these 10,000 seasons, we take some averages and calculate some stats to see how many games each team is likely to win on average, their probability of going undefeated, and more.

    (more…)
  • The Most Consistent Quarterbacks in College Football

    The Most Consistent Quarterbacks in College Football

    Do you ever feel like your team’s quarterback chokes away the game’s biggest moments, or that he is a “baller” and elevates his game in the last two minutes? Well you’re in luck. I looked at just that, to see which QBs play differently given the situation they’re in in the game.

    I looked at some basic QB stats like success rate, completion rate, and interception rate, and then broke them down based on some game situations like playing down, close games (10 or less point-differential), final two minutes, and quarter to see which players were the most and least consistent in different situations. My guess was that the best players in college football would either be the same or elevate their game in these situations.

    You may notice that some of college football’s biggest stars from 2020 (Justin Fields, Mac Jones, Trevor Lawrence, etc.) are missing from many of these graphs. That’s because they didn’t find themselves in a lot of these situations too often, thanks to the dominance of their teams. Rarely did they trail in games, or have to pass in the last two minutes. So therefore, they’ve been excluded for having so few attempts in many of these situations.

    Playing Down

    First, we’ll start by looking at who plays well (and poorly) while losing a game. I’ve taken each player’s change in completion rate when losing a game compared to when they’re winning a game on the x-axis, and their change in interception rate when losing compared to when winning on the y-axis, meaning that players who are throwing more incompletions and interceptions than normal when they start losing will be in the top left, and players who throw less interceptions and complete more passes will go to the bottom right.

    A lot of players increase their interception rate when they’re losing, indicating that they’re taking more risks to try to catch up. Very few actually throw fewer interceptions. Below is the same graph, but the most consistent players are highlighted instead.

    Another way of looking at this could be with change in success rate on the y-axis instead. As a quick refresher, success rate is the rate of plays deemed successful, meaning gaining 5+ yards on 1st down, 70% of the yards to go on 2nd down, and all of the remaining yards to go on 3rd and 4th downs.

    A few guys stand out above the rest here in playing better when down and, unsurprisingly, they were three of the biggest names in College Football last year: Feleipe Franks, Ian Book, and D.J. Uiagalelei.

    Close Games

    Here is the same graph, but looking at the difference in stats between playing in a close game or not. I defined a close game as anything within 10 points or less separating the teams. Here are some of the outliers when it comes to playing better (or worse) in a close game.

    And below, you’ll find who the most consistent players are whether the game is close or not.

    Late Game

    Here, we’re looking at QB play in the final two minutes of regular time. This graph has considerably fewer players because there weren’t as many quarterbacks who had thrown at least 10 passes in the last two minutes last season. Most teams that are winning will run the ball in the last two minutes, so that leaves only the QBs that trailed, and likely trailed more than once, late in games. Throw in a shortened season and our opportunities to collect this data last season were limited. Still, we see a good representation of players who stepped up, or crumbled, in the final two minutes.

    Quarter to Quarter

    Last, I looked at success and completion rates from quarter to quarter to see if anything stood out. The darker boxes show greater variation in consistency from one quarter to the next. This first one shows success rate.

    And last but not least, here’s how each QB’s completion rate changes by quarter.