College Football

  • Home-Field Advantage in 2020? It’s Complicated

    Home-Field Advantage in 2020? It’s Complicated

    You’ve heard of home-field advantage, but it’s always in the context of the advantage that a home-crowd gives a team. But what if that stadium were empty? Well sure enough, we saw just that last year.


    Home-field advantage changed in 2020. That’s for sure. But by how much and why is less certain. Take, for instance, the distribution of home records over the past 6 seasons. As you’ll see, 2020 saw more teams with weaker home records, some getting shut out completely, a rare occurrence in past years.

    Density plot of home winning percentages in college football over the past six seasons. 2020 saw more teams with home records below 50%.
    Density plot of home winning percentages in college football over the past six seasons. 2020 saw more teams with home records below 50%.

    However, this doesn’t tell the full story, because, as we know, in 2020 teams played abbreviated schedules and dealt with last-minute cancellations, leading to a smaller slate of home games for some teams. Here’s the distribution of the number of home games played in 2020 vs. 2019.

    Distribution of number of home games played and count of teams in 2020 vs. 2019. In 2019, every team played 5 or more home games while last year, 69 teams played 4 or less.
    Distribution of number of home games played and count of teams in 2020 vs. 2019. In 2019, every team played 5 or more home games while last year, 69 teams played 4 or less.

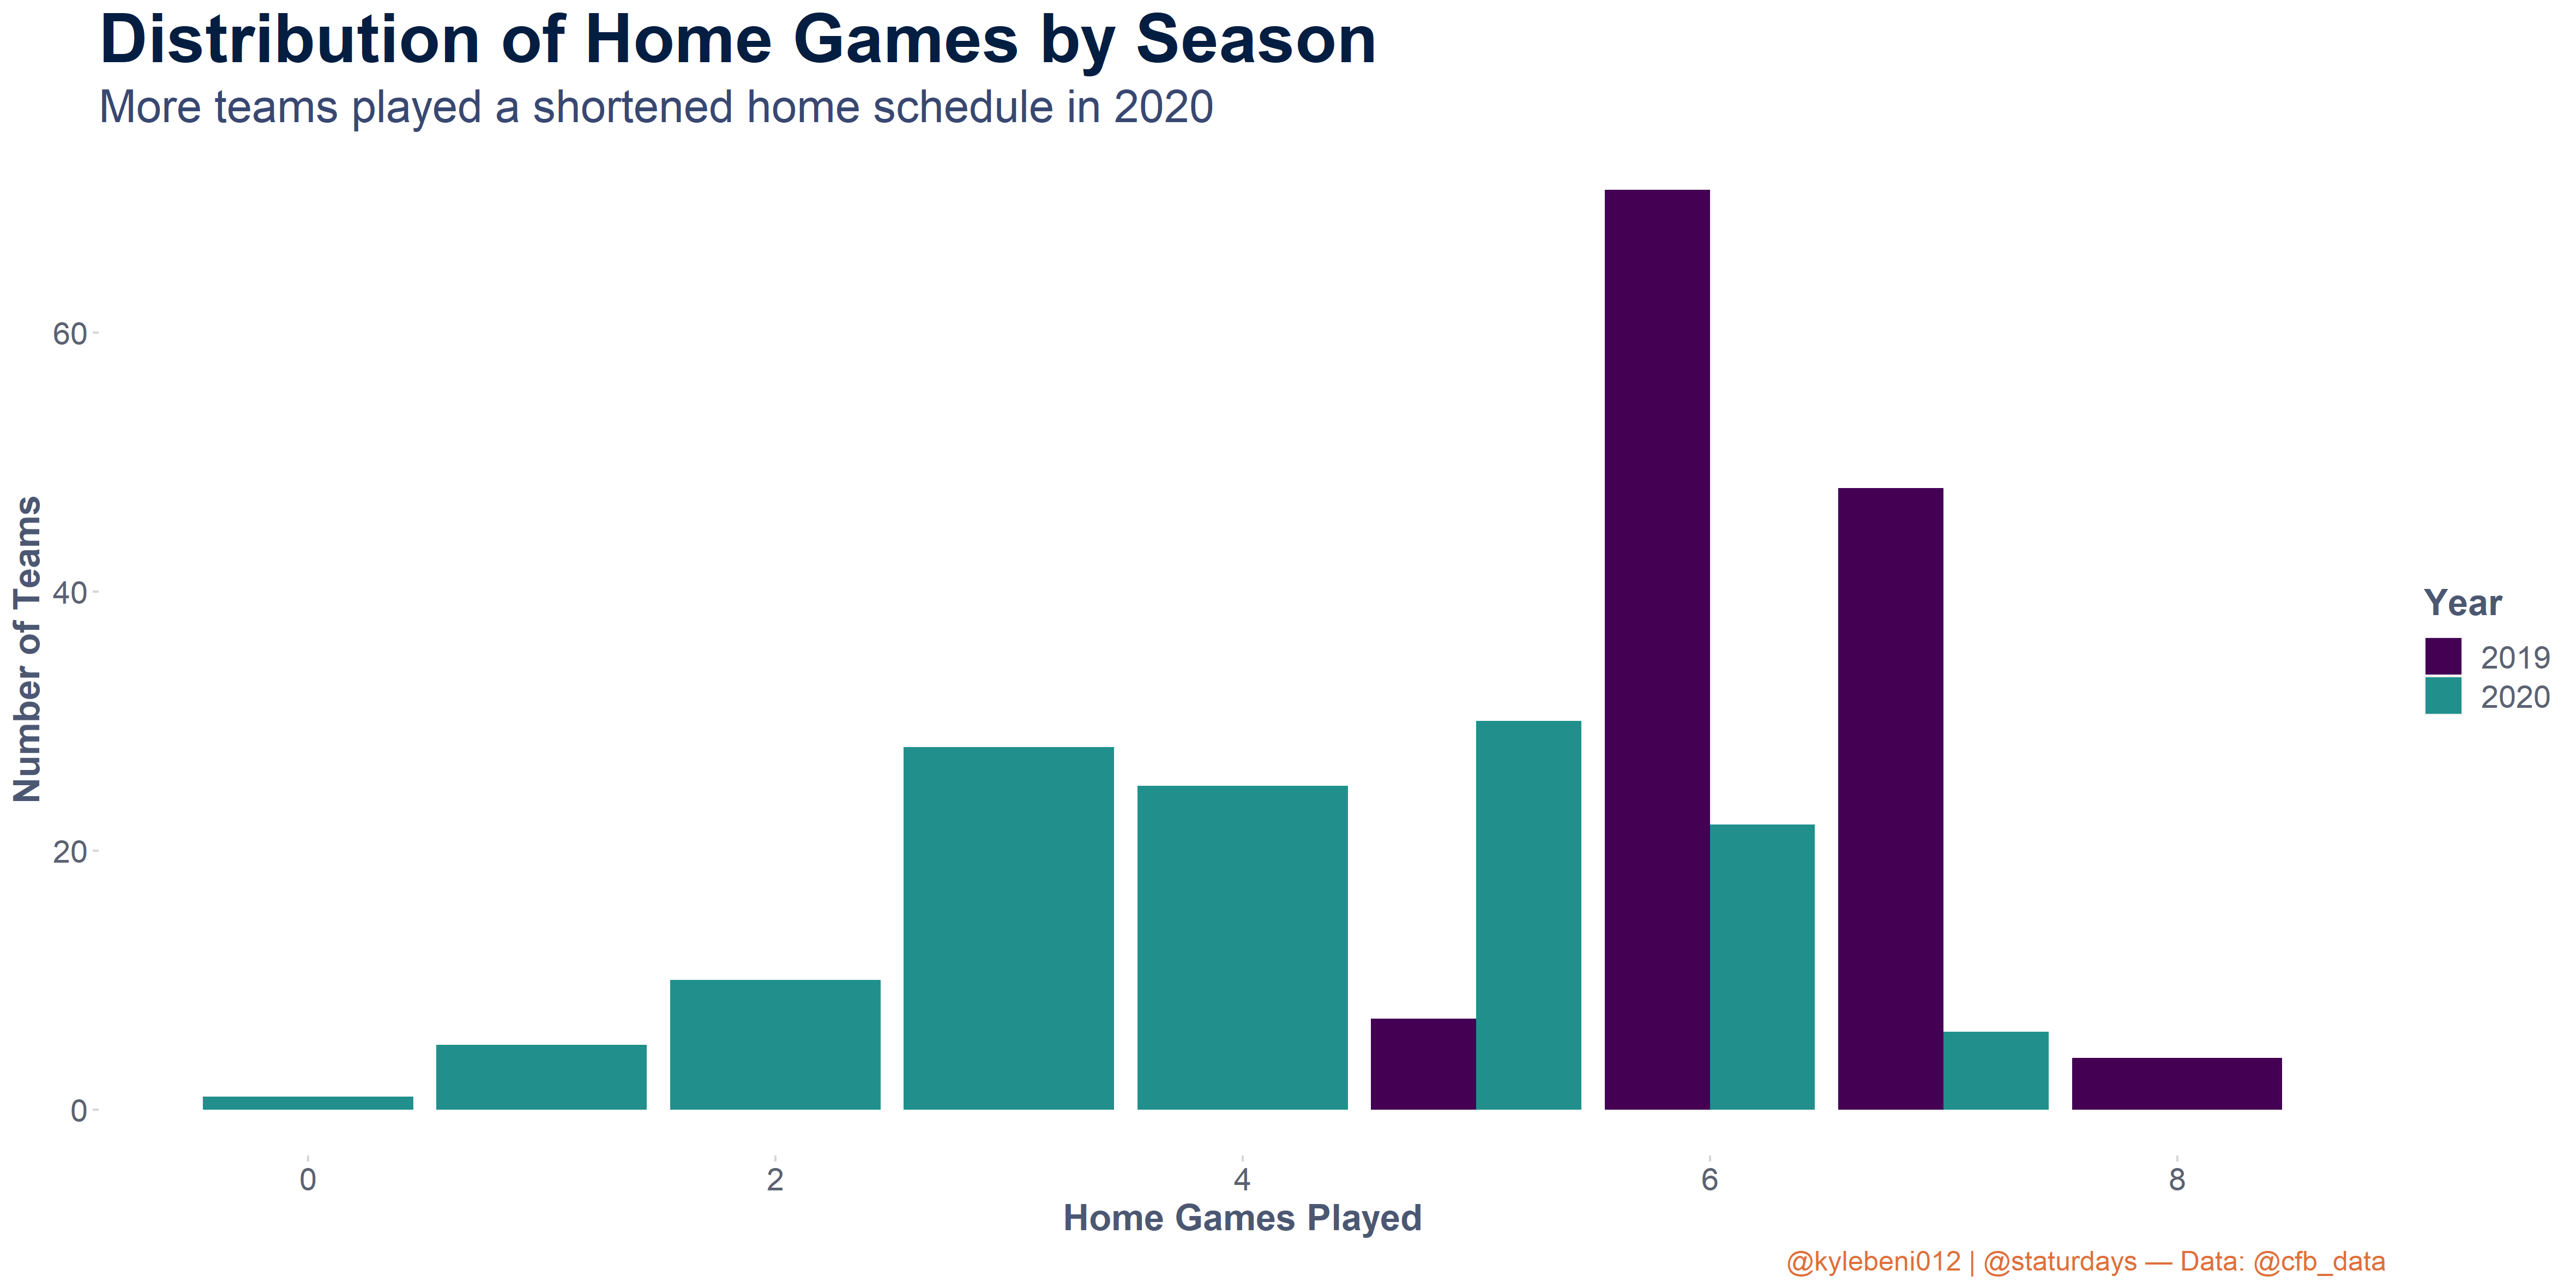
    So more than half of D-I teams played 4 or less home games. This led to a lot of variability in their results. Almost every conference also played an exclusively conference-only schedule last year, upping the quality of their competition in those home games. Naturally, we’d expect their home-record to drop as the average quality of their opponent went up.

    When we filter for only those teams that played at least six home games in 2020, we get a much different story.

    Density plot for home winning percentage for the past six seasons, filtered for teams that played at least six games at home each season. 2020 has a higher density at the right side of the graph, and a lower density in the middle of the graph for 50% win rates.
    Density plot for home winning percentage for the past six seasons, filtered for teams that played at least six games at home each season. 2020 has a higher density at the right side of the graph, and a lower density in the middle of the graph for 50% win rates.

    Well now what? This looks like teams actually played better at home when they got their 6+ games in. And in fact, they did play better on average at home in 2020 than the overall average in the previous five seasons. Teams in 2020 won 71% of their home games when they played six or more of them. From 2015-2019, that number was 64%. The difference is statistically significant with 95% confidence.

    That being said, when you include all teams, regardless of how many home games they played, the difference between home-records in 2020 was statistically significantly worse than the preceding five seasons. So when teams were able to get all their games in, they saw improved home-field advantage, and when they didn’t get their normal games in, they struggled at home.

    So how can we make sense of this trend? I don’t know that we can entirely understand the difference. Only 28 teams out of 127 got 6 or more games in in 2020. 10 were from the ACC, and then a mix of Sun Belt, Independent, Conference USA, and a few Big 12 and American Athletic conferences. The overwhelming majority of these teams were from the South, where eased restrictions meant more fans at home games, which could have given them improved home-field advantage.

    Elo Ratings between the two groups were almost identical going into 2020, but were 50 points higher when the season ended for the teams that played all their home games.

    We also need to remember that conferences like the Big Ten only played 9 games, all in-conference. So we would expect their win percentage to decrease significantly in a season where they effectively lost one or two near-guaranteed home-wins against non-conference cupcakes. Who knows what would have happened with an extra three games. We saw teams start off slow and finish the season on a run, adjusting to the new normal of the 2020 season. We also saw teams fall off, falling victim to opt-outs, infections, and lack of motivation.

    So while, in part, the full-season teams played better than usual, it is likely that had more teams gotten in a full-season’s worth of games, they would have dragged the home-field advantage down to below-average levels. There is no doubt that the overall landscape in college football favored the away team more than in any other season in at least the past 20 years.

    This year, we’ll see how much that home-field winning percentage rebounds as fans return in full force in most stadiums. And we can’t wait to see it.

    Have a theory about why those 28 teams played better at home in 2020? Email me at kyle@staturdays.com or tweet us @Staturdays on Twitter.

  • Predicting the Heisman Winner After Kyle Trask’s 3-Interception Loss

    Kyle Trask was a “shoe”-in for Heisman. Now the shoe is on the other foot (Mac Jones’s).

    The name Kyle had gotten a bad rap in the last year. People think that all we do is drink Monsters and pop wheelies on our ATVs with our cousins at the campground. Kyle Trask was supposed to show the world that us Kyles are so much more. That we could be Heisman-winners and SEC champions too. Not so fast my friend.

    I cannot understate enough how consequential a single shoe has become to not only Kyle Trask’s Heisman campaign, but also Florida’s shot at a College Football Playoff spot.

    For those of you who have no clue what I’m talking about (doubtful, but possible), it’s probably easiest if you just watch this video.

    Let’s start with the latter: Florida were unlikely to beat Alabama as it were, with Elo giving them around a 20% chance to win the game (with the LSU loss). Had they done that, they’d easily be in the College Football Playoff. Now, it’s unclear if a two-loss Florida could get in regardless of the result of this game, unless they had a performance so dominant against the best team in the nation that it couldn’t possibly be a fluke. That is even less likely than them winning by any margin.

    Now the Heisman. Trask was a 52% favorite to win the Heisman last week. After a 3-interception loss, Kyle Trask dropped all the way to 11% odds (+800). Mac Jones went to the 66% favorite, followed by Devonta Smith at 33%. We’ve been working on a model to predict Heisman winners for the past two weeks using a few data sources from collegefootballdata.com. As of last week, Kyle Trask had the best odds to be the Heisman winner. Now, Jones has closed the gap.

    The two major stats that were negatively affected by that LSU loss were team record (8-2) and interceptions thrown (+3). Only one of those two is significant to determining the Heisman winner: team record.

    We built our model using data from 2004 through 2019, pairing up the most common passing, rushing, and receiving stats for each player with the eventual Heisman winner. This is inherently tricky because a Heisman winner is inherently rare. Out of about 42,000 player-season combos, there can only be 17 Heisman winners in that span. Despite that, we did a decent job of getting some fairly accurate Heisman odds historically, and the winner of the Heisman was the player with the highest odds in our model 11 out of 17 years.

    The most important and significant factors that determined whether a player might win the Heisman ended up being:

    • The team’s winning percentage in the regular season
    • A player’s rushing yards relative to others at their position in that season
    • Total Touchdowns per Game (it should be noted that total touchdowns for the season were pretty much equally significant, but since this season is shortened for some teams, we opted for the per-game stat)

    Interestingly, our model still did better at identifying true Heisman candidates when we included more variables, even if they were statistically insignificant. Some of the variables we left in despite their perceived unimportance were:

    • interceptions per game
    • player position
    • total yards per game
    • Power Five conference indicator

    The inclusion of these extra variables sniffed out a few clear outliers that weren’t even in consideration, namely the Cincinnati QB and RB, who have put up large numbers, but are not in a Power 5 conference, a defining characteristic of previous Heisman winners (despite that, P5 conference was still considered insignificant on its own, likely because so many Power 5 players do not win the Heisman each year, while many players who score 50+ touchdowns do (six out of 15, to be specific).

    Cincy QB Desmond Ridder also threw .75 interceptions per game this year, a seemingly insignificant amount, but not when Fields, Trask, and Jones average .6, .5, and .3, respectively. It’s a tough world out there these days.

    The results were fairly promising. Like I said, there are only 16 winners, and thousands of losers each season, so most players are going to have an essentially 0% chance of winning the Heisman. But when we look at the top 5 players in terms of Heisman probability each season, we see that the actual winner did in fact have much higher odds then the next four runner-ups, showing that our model is on the right track.

    So the actual Heisman winner usually had the highest win probability to win the award on average, while the runner-ups came in around 12% probability.

    Here is a look at how total TDs correspond to the probabilities to win the Heisman that our model gives.

    This stat is clearly most important with QBs, as many of the Heisman-winning QBs had total TDs in the upper 40s or lower 50s. Matt Leinart and Troy Smith were two exceptions, with Leinart having the lowest predicted win probability of the players we looked at, undoubtedly helped by being the QB on an undefeated USC team that year.

    So who are the Heisman favorites in our model this year?

    The top five this year are:

    1. Justin Fields (25.8% chance)
    2. Kyle Trask (19.9%)
    3. Mac Jones (17.3%)
    4. Najee Harris (14.4%)
    5. Kedon Slovis (6.7%)

    Now remember, we are using per game numbers here, but we can almost certainly rule out Slovis and Fields who will only have played six games by the time the ballots are cast: enough games to warrant a playoff spot, maybe, but not a “Most Outstanding Player in College Football” trophy.

    What you can take away from Fields sitting on top of our rankings is that he was on-track for a Heisman-caliber season.

    Despite losing to unranked LSU in a three-pick game, Trask still leads in our odds thanks to his considerable lead in total TDs and TDs/game (4.2 for Trask to 2.8 for Jones). However, you have to feel like this conference championship game will decide things one way or another, with the top 2 QBs facing off head-to-head. They are, after all, separated by only 2.6 percentage points in our probabilities, and TDs aren’t everything, as we saw in the above plot.

    For those wondering about DeVonta Smith, Alabama wide receiver, he comes in at #6, followed by Trevor Lawrence at #7. While Smith is certainly having a great year, he may be hurt by the fact that our 16 years of model-training hadn’t seen a WR win the Heisman once. That, and the fact that he has two teammates performing at equally, if not more historic levels.

    Najee Harris is performing at Top-10 levels at his position in terms of total TDs, compared to other RBs in 2020. In terms of TDs per game, he is also in the top ten, though many others above him did better, none of which won the Heisman. However, only one of them was also on an undefeated team: Jaret Patterson of Buffalo (this year), who are in the MAC. So Najee has a chance, but it seems unlikely despite his outperformance of his peers. The less-prestigious Doak Walker Award (for the top back in College Football)? For sure.

    Again, we have to discount Fields despite his stellar performance so far in the air and on the ground. You can see neither of the top QBs in contention have much of a run game, so it will come down to TDs and win percentage. I think Florida need to win on Saturday to get Trask his Heisman. Otherwise, it’s going to ‘Bama (but I won’t say who at ‘Bama).

  • Week 16 Elo Rankings

    Week 16 Elo Rankings

    Well folks, after 15 weeks that felt like 30 weeks, we finally made it. Conference Championship week is here, and all five Power-5 conferences are hosting games. We’ll have those win probabilities up later this week, but for now, let’s see how the Elo rankings look after the regular season.

    For more CFB Playoff analysis, subscribe to the Staturdays newsletter for weekly college football stats and insight straight to your inbox. I’ll be looking deeper into the Heisman trophy race this week.

    College Football Elo Rankings for Week 16