Kyle Bennison

  • Separating the Fans from the Stadium: Stadium Size, Attendance, and Home-Record in College Football

    Separating the Fans from the Stadium: Stadium Size, Attendance, and Home-Record in College Football

    Today we’re looking at the interwoven relationships between stadium-size and attendance and a team’s performance at home and away. We’ll look at how this relationship changed in 2020 when fans were not able to attend most games.

    We’re going to try to separate the attendance from the venue size to see if having a packed house makes a difference, regardless of a team’s overall strength.

    First, a few primers to understand the data we’re dealing with.

    Let’s look at the distribution of venue sizes in college football.

    Distribution of venue sizes in College Football. The most common stadium-size is 30,000 seats.

    The most popular stadium size appears to be right around 30,000 seats. I’m not sure if this is a rounding thing, or if it just a nice number that a lot of teams settled on. Either way, there are a handful of college football cathedrals, with 90,000+ capacity, but most are under 60,000.

    And, believe it or not, the size of your stadium matters. There is indeed a relationship between stadium size and the performance of your team at home, although this can almost certainly be chalked up to the best, most-historic teams in college football growing their stadium size over time to accommodate the demands of their fans. And whether that drives good recruits and good results, or vice-versa, the best teams typically play in the largest stadiums (in the past 20 years).

    Boxplot of stadium capacity and home winning percentage. There is a slight positive relationship, and as stadium capacity increases, the uncertainty of results is narrower and teams tend to have a winning season at home.

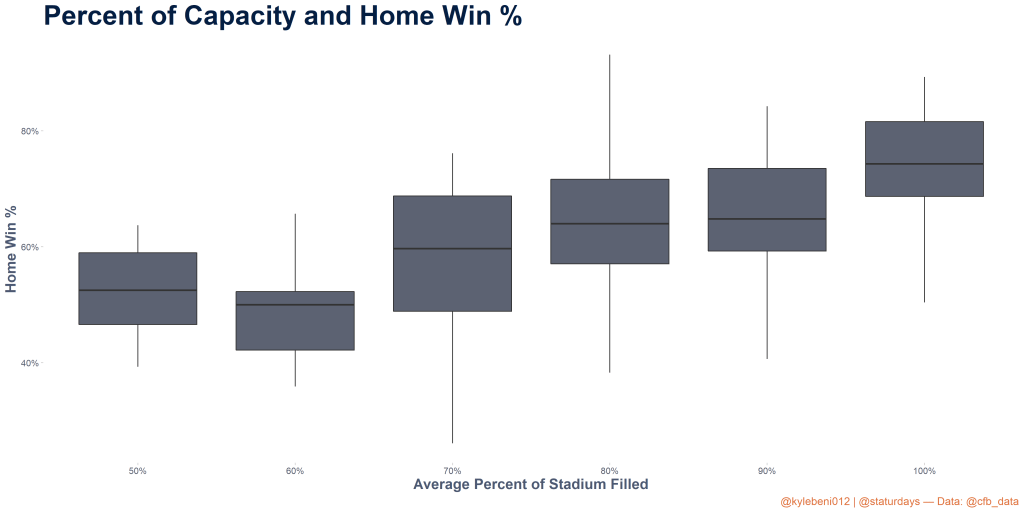
    As you can see, there is a slight positive relationship, and as stadium capacity increases, the uncertainty of results is narrower and teams tend to have a winning season at home. However, actual attendance at these games appears to be a more important factor.

    Boxplot of average home attendance and home winning percentage. There is a large uptick in winning percentage when you gather at least a handful of fans.

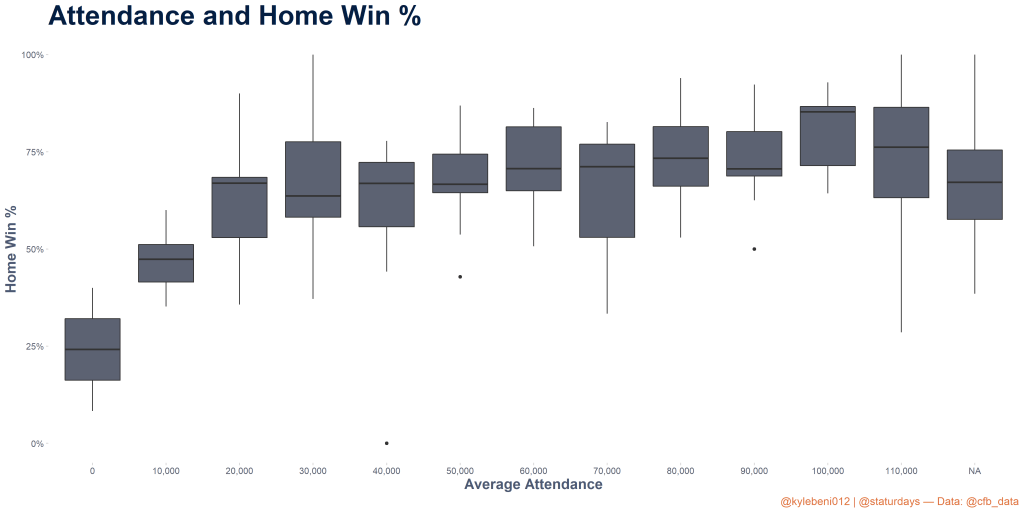
    Now we have to take this with a grain of salt, because attendance data can be murky. Some games have no attendance data at all. Others may be way off. It’s impossible to be certain, but there’s at least some positive trend between fans showing up to your games and playing well at home. This shouldn’t come as much of a surprise, although it is surprising that the difference between 50,000 fans and 100,000 seems negligible, indicating that the home field advantage of some of the largest brands in college football might not be all it’s cracked up to be. Of course, the biggest teams are also probably playing some pretty tough opponents in those mega stadiums.

    Boxplot with average percent of stadium capacity filled for each team rounded to the nearest tenth, and home winning percentage on the y axis. There is, again, a positive relationship. Average attendances below 50% or above 100% were filtered out for low sample size.

    When we put all of these relationships—stadium capacity, raw attendance, and percent of the stadium filled—side by side, we see that they all have a pretty similar relationship to one another and a pretty similar relationship to wins.
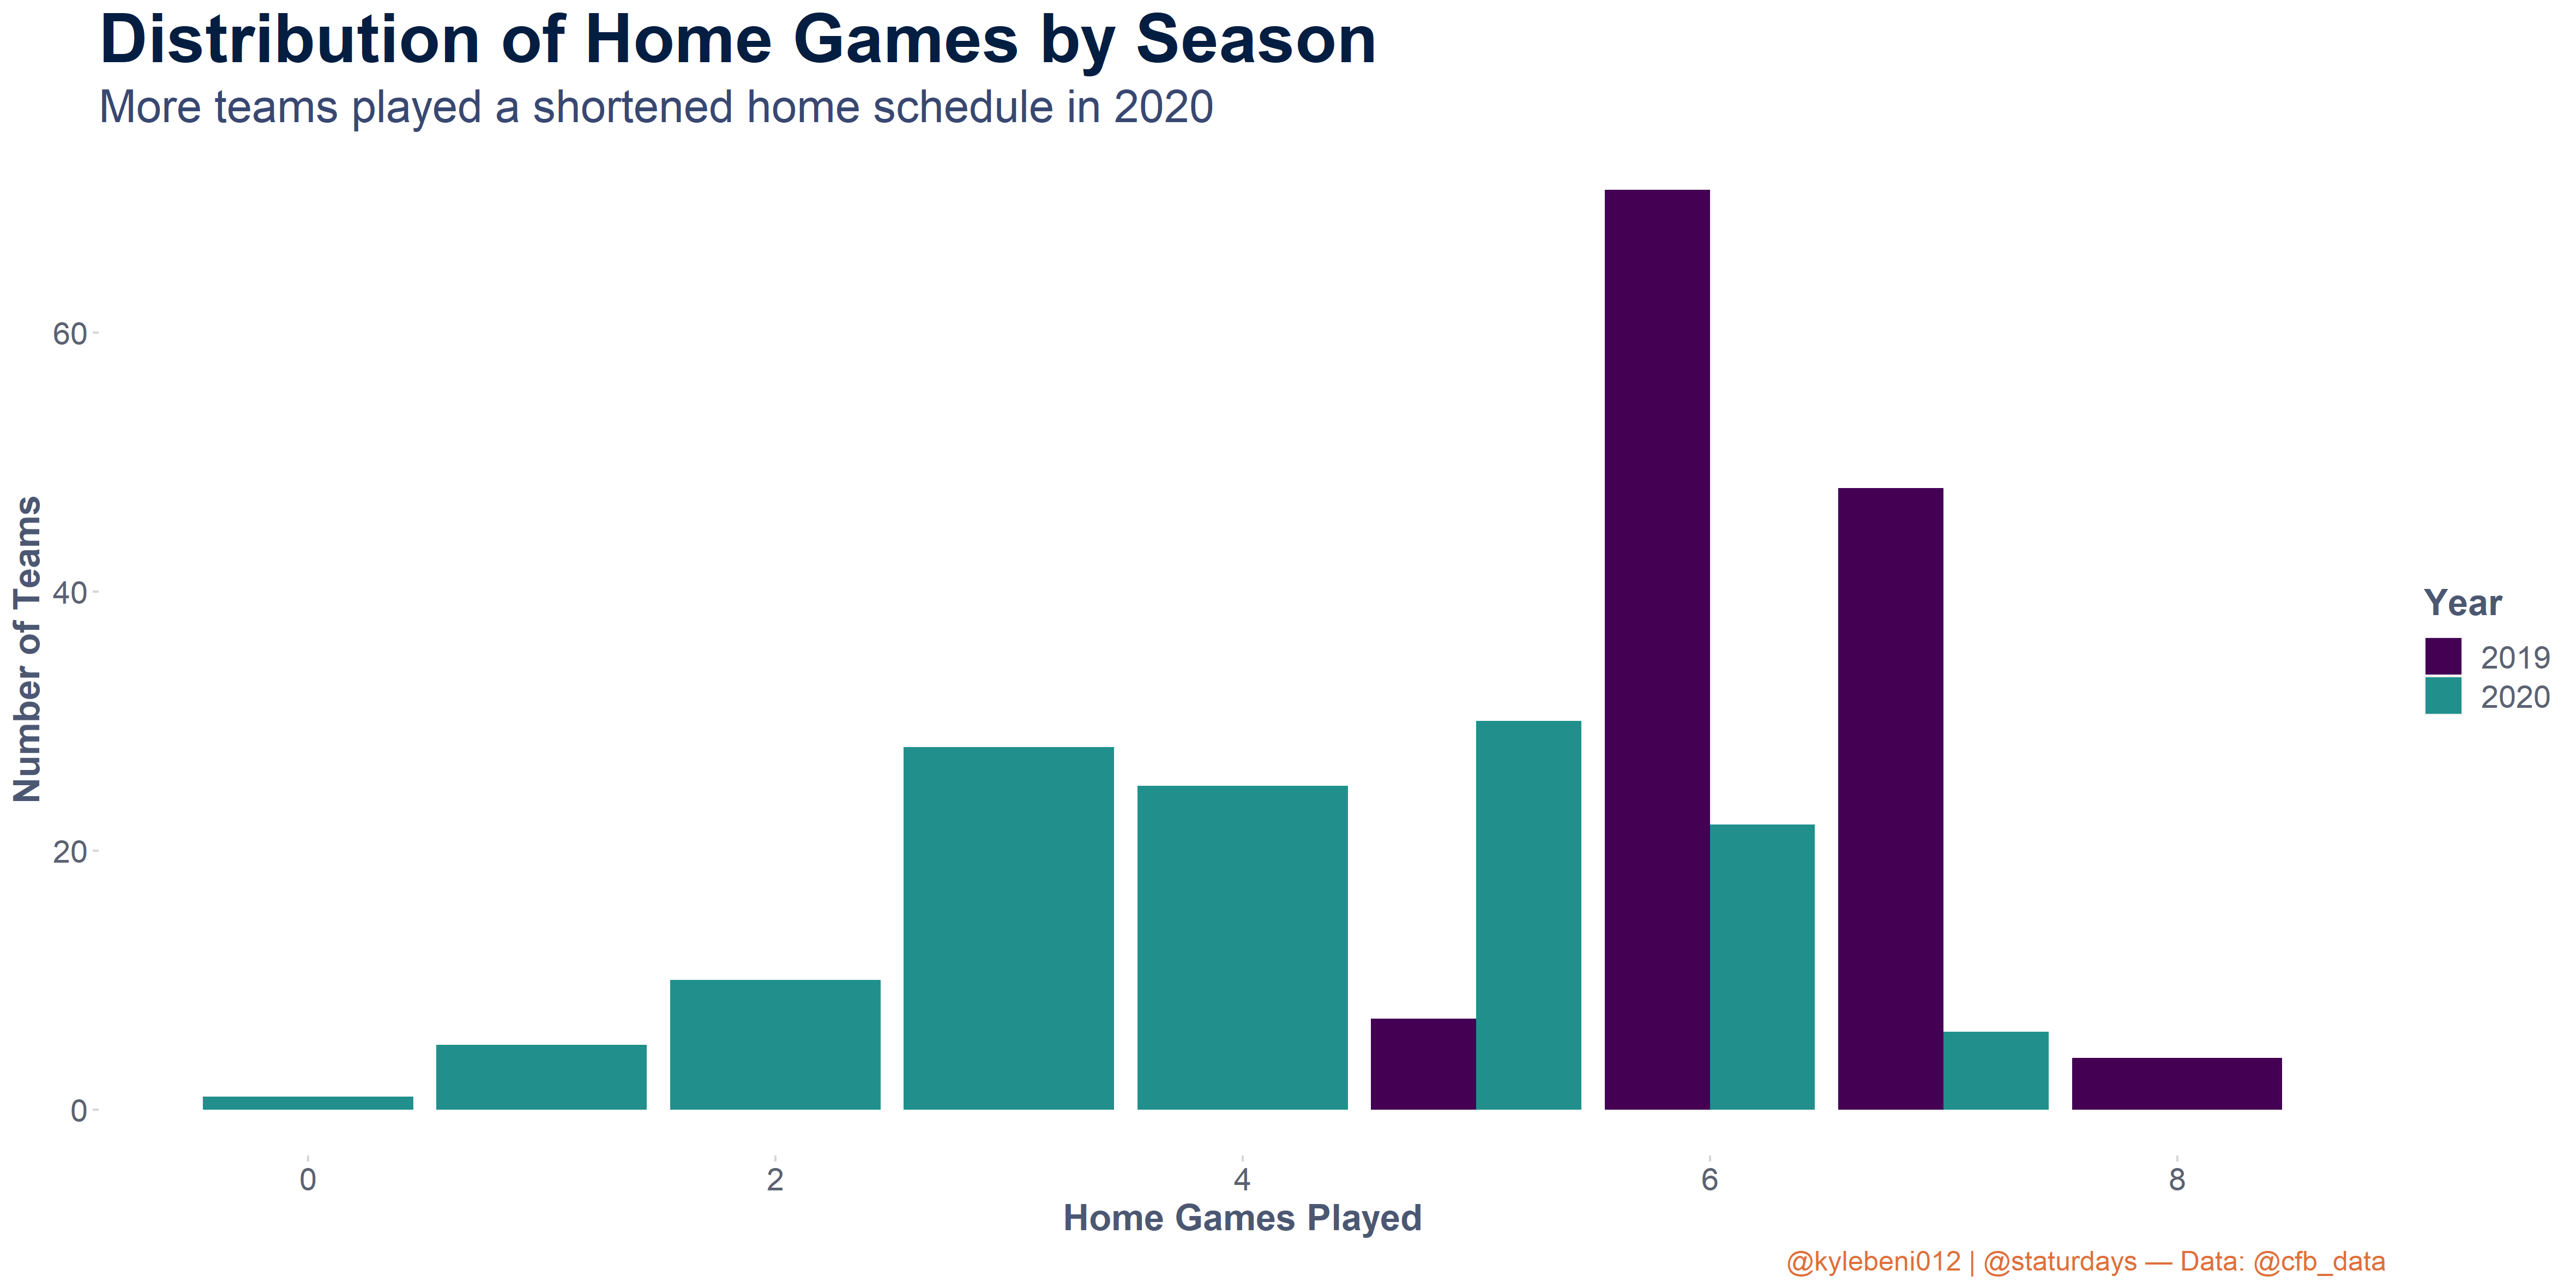
    Side-by-side scatterplots of capacity, attendance, and percent of total capacity on the x-axis vs. home winning percentage on the y-axis. All have similar positive linear relationships.

    Empty Stadiums

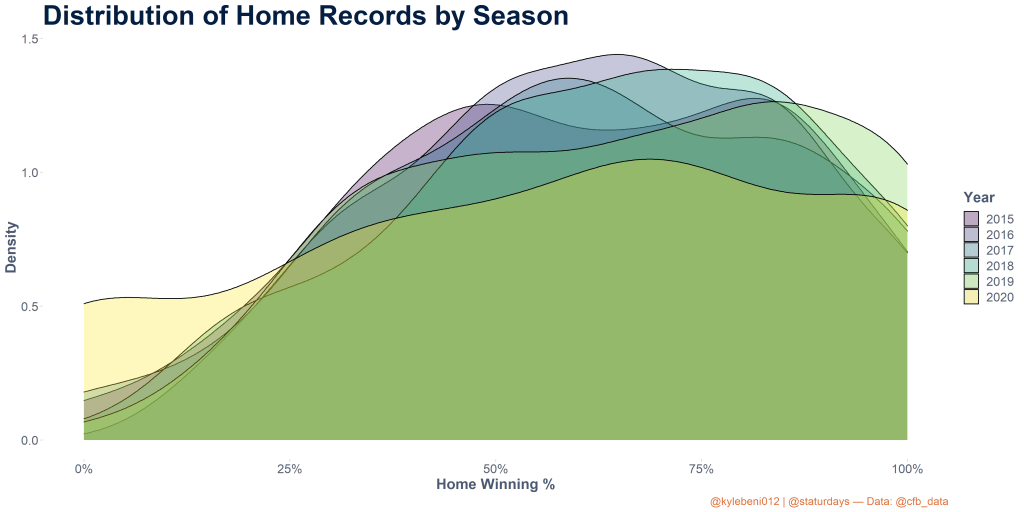
    Let’s quickly take a look at how this changed in 2020. We saw previously that there is some relationship between stadium size and home record, but most of that is likely attributable to the people inside that big stadium, not just the stadium itself. In 2020, look at how that advantage disappeared as those intimidating and loud fans became smiling cardboard cutouts.

    Multiple scatterplots of stadium capacity and home winning percentage, grouped by season from 2000 – 2020. In 2020, the relationship between these two variables went from slightly positive to almost 0.

    In almost every season since 2000, the correlation between stadium size and home record was between .2 and .4 and once as high as .41. In 2020, it dropped to historical lows of just 0.08, or almost no relationship between how big a stadium a team was in and how well they played at home. The factor that changed here, of course, was the fans, not the stadiums. And this data includes even the teams that allowed fans for some or all of 2020, so the correlation could have been even worse than this.

    So from this plot alone we can see that fans matter a lot more than the stadium size.

    So next, let’s try to tease out how much each of these factors matters in the grand scheme of winning football games at home.

    Controlling For Team Strength

    In order to accurately access the importance of stadium capacity and fan attendance, I need to control for something important: overall team strength. And by control, we really just mean including it as a factor in our regression model. Because without it, the model might confuse stadium size with being more important than it is, simply because it doesn’t know that better teams tend to have bigger stadiums to begin with. By adding in a variable that indicates how good a team is, we can look at similarly-ranked teams and see if their stadium-size has an impact on their performance, given that their overall team strengths are similar.

    To do this, I’m choosing to use a team’s away record as a proxy for overall team performance. I could use Elo ratings, or even AP Poll rankings, but I feel like away performances are fair because you have no home-field advantage and it’s just up to your team to perform. This assumes that the quality of away opponents is fairly evenly distributed among teams of different stadium sizes. This may not always be the case, but the majority of the season (3/4 of it) are reserved for in-conference matchups, which are the better games, and non-conference games, if they are easy opponents, are usually reserved for early-season home games (or that week where Alabama takes a week off in November to beat Grambling State by 80).

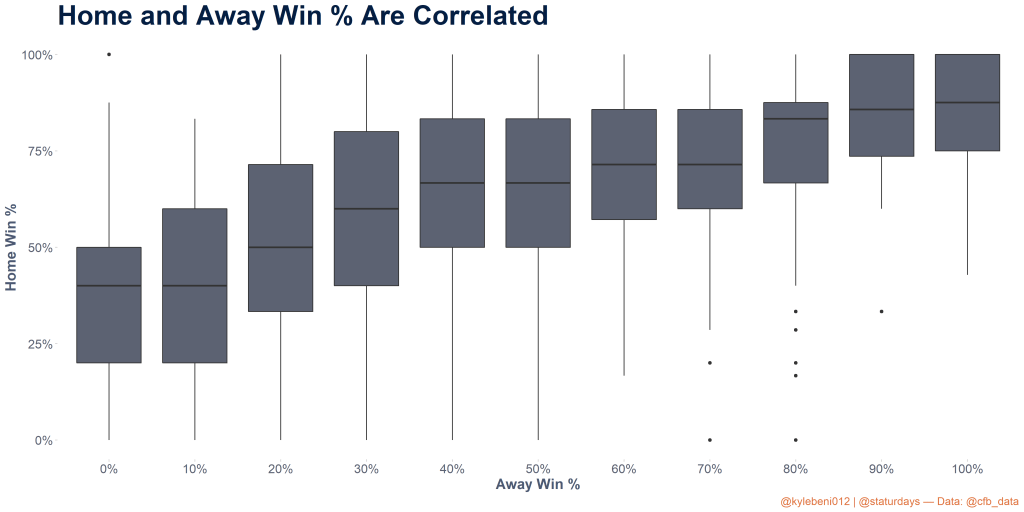
    Just to confirm, how teams play at home and away are related, and this relationship is fairly strong.

    Correlation between home winning percentage and away winning percentage, represented as boxplots for each 10% winning percentage. There is a fairly strong positive relationship between the two, with teams that win 90% or more of home games rarely losing more than 25% of their away matchups.

    What Drives Home Game Attendance?

    An interesting finding of my data exploration was that home attendance actually correlates more to away performances than home performances. The reasoning behind this might be that fans watch their teams play well on the road, and then get a desire to go see them in person when they’re home. If they watch their team on TV and they stink, they’ll be less motivated to go buy a ticket to see that trainwreck in person.

    Home and Away winning percentages plotted against average percent of stadium capacity at home games. Performing well away from home actually leads to higher likelihood of sellout crowds than home performances.

    So teams that play completely average and win 50% of games are better off doing so away from home, as it leads to nearly 15% higher home capacity than doing the same at home.


    Building A Regression Model

    Okay, let’s finally get into it and put some numbers to these relationships. We’re going to build a linear regression model to see if the relationship between stadium size and home record is significant, along with how significant the other factors like attendance and away record are in determining home record.

    Since we’re trying to get an idea of how important each feature is in the regression, we need to ensure that no two variables are too highly correlated. I used Variance Inflation Factor (VIF) to determine this, and found that attendance and stadium size are too similar to use both (they are correlated at 90%), however stadium size and percent of the stadium filled on average are not, so I dropped raw attendance data and instead went with the following three variables:

    • Stadium Size
    • Average percent of capacity filled
    • Away Record

    I’m using this to predict a team’s average home record over the course of their games at that stadium. For this reason, I’m using a linear model since the response variable is continuous from 0 to 1. Note: in hindsight, the best model to use in this situation would be a Beta Regression, which is specifically for continuous response variable s between 0 and 1 like my situation, however not knowing much about it, I’m not going to get into it for the sake of simplicity. I’m not doing rocket-science here, after all.

    Results of linear model. Only the team’s away record was significant.

    After running the model with those three variables, we find that neither stadium size nor percent of capacity are significant factors when team strength (via away record) is included in the model. This indicates that regardless of the size of stadium a team plays in or how packed the house is on average, they will perform to their best abilities over time. This is fair, but what if we look at an individual game. Can we gain any predictive power by factoring in the crowd size or venue when trying to determine the outcome of one game?

    This time, I chose to use logistic regression to see if a model that included the attendance, stadium capacity, and percent of the stadium filled could outperform one that solely relied on the Elo rating of the two teams. We’re using logistic regression because we’re trying to predict a simple True/False of whether the home team won the game or not. This data excluded 2020 because the attendance data is far from complete, so we’ll just assume it’s a normal year. And in a normal year, it turns out that none of those variables are useful relative to Elo ratings alone.

    Results of logistic regression. Only the Elo rating was significant.

    The size of the stadium was the closest variable to being significant, but I would guess that the model was recognizing some of the larger stadiums and starting to correlate that to a better outcome for the home team, when in fact the physical size and capacity of the venue doesn’t mean much. Similarly, the number of people in the stadium or percent of the stadium filled didn’t seem to matter either.

  • Home-Field Advantage in 2020? It’s Complicated

    Home-Field Advantage in 2020? It’s Complicated

    You’ve heard of home-field advantage, but it’s always in the context of the advantage that a home-crowd gives a team. But what if that stadium were empty? Well sure enough, we saw just that last year.


    Home-field advantage changed in 2020. That’s for sure. But by how much and why is less certain. Take, for instance, the distribution of home records over the past 6 seasons. As you’ll see, 2020 saw more teams with weaker home records, some getting shut out completely, a rare occurrence in past years.

    Density plot of home winning percentages in college football over the past six seasons. 2020 saw more teams with home records below 50%.
    Density plot of home winning percentages in college football over the past six seasons. 2020 saw more teams with home records below 50%.

    However, this doesn’t tell the full story, because, as we know, in 2020 teams played abbreviated schedules and dealt with last-minute cancellations, leading to a smaller slate of home games for some teams. Here’s the distribution of the number of home games played in 2020 vs. 2019.

    Distribution of number of home games played and count of teams in 2020 vs. 2019. In 2019, every team played 5 or more home games while last year, 69 teams played 4 or less.
    Distribution of number of home games played and count of teams in 2020 vs. 2019. In 2019, every team played 5 or more home games while last year, 69 teams played 4 or less.

    So more than half of D-I teams played 4 or less home games. This led to a lot of variability in their results. Almost every conference also played an exclusively conference-only schedule last year, upping the quality of their competition in those home games. Naturally, we’d expect their home-record to drop as the average quality of their opponent went up.

    When we filter for only those teams that played at least six home games in 2020, we get a much different story.

    Density plot for home winning percentage for the past six seasons, filtered for teams that played at least six games at home each season. 2020 has a higher density at the right side of the graph, and a lower density in the middle of the graph for 50% win rates.
    Density plot for home winning percentage for the past six seasons, filtered for teams that played at least six games at home each season. 2020 has a higher density at the right side of the graph, and a lower density in the middle of the graph for 50% win rates.

    Well now what? This looks like teams actually played better at home when they got their 6+ games in. And in fact, they did play better on average at home in 2020 than the overall average in the previous five seasons. Teams in 2020 won 71% of their home games when they played six or more of them. From 2015-2019, that number was 64%. The difference is statistically significant with 95% confidence.

    That being said, when you include all teams, regardless of how many home games they played, the difference between home-records in 2020 was statistically significantly worse than the preceding five seasons. So when teams were able to get all their games in, they saw improved home-field advantage, and when they didn’t get their normal games in, they struggled at home.

    So how can we make sense of this trend? I don’t know that we can entirely understand the difference. Only 28 teams out of 127 got 6 or more games in in 2020. 10 were from the ACC, and then a mix of Sun Belt, Independent, Conference USA, and a few Big 12 and American Athletic conferences. The overwhelming majority of these teams were from the South, where eased restrictions meant more fans at home games, which could have given them improved home-field advantage.

    Elo Ratings between the two groups were almost identical going into 2020, but were 50 points higher when the season ended for the teams that played all their home games.

    We also need to remember that conferences like the Big Ten only played 9 games, all in-conference. So we would expect their win percentage to decrease significantly in a season where they effectively lost one or two near-guaranteed home-wins against non-conference cupcakes. Who knows what would have happened with an extra three games. We saw teams start off slow and finish the season on a run, adjusting to the new normal of the 2020 season. We also saw teams fall off, falling victim to opt-outs, infections, and lack of motivation.

    So while, in part, the full-season teams played better than usual, it is likely that had more teams gotten in a full-season’s worth of games, they would have dragged the home-field advantage down to below-average levels. There is no doubt that the overall landscape in college football favored the away team more than in any other season in at least the past 20 years.

    This year, we’ll see how much that home-field winning percentage rebounds as fans return in full force in most stadiums. And we can’t wait to see it.

    Have a theory about why those 28 teams played better at home in 2020? Email me at kyle@staturdays.com or tweet us @Staturdays on Twitter.

  • Was the 2020 College Football Season a Success?

    Now before you close out of this article, I’m going to warn you: I’m going to bash college football, the sport you and I both love, a lot during this article. I’m also going to give it some credit. Please don’t get mad: I’ve tried to give as fair and thorough an analysis of the college football season as I can. So if you’ll stay with me through to the end, hopefully you’ll agree.

    The 2020 college football season comes to a close with Alabama crowned champion in a season like no other before it and hopefully after it. However, there’s an empty feeling inside as I reflect back on the season we just witnessed. Sure, there were some highs, some great moments, some exciting games enjoyed by fans and casual viewers alike. But it left me with a hollow feeling, as empty as many of the stadiums where the games were played this year.

    So I wonder: was playing college football in the fall of 2020 worth it? Was it the right decision? Was the benefit of a partially funded athletic department worth the unknowable number of additional COVID cases and deaths sourced from outbreaks at practice facilities around the country? Let’s go through the pros and cons of a season made up of perseverance, protocols, and conflicting priorities.

    One more quick note: you’ll notice a lot of the pros have cons mixed in, and a lot of the cons have pros. This was inevitable as I wrote and found multiple sides to each story, and further illustrates the gray area we are all living in each day amid this pandemic. There is no single right or wrong answer to most things.

    Why the 2020 season was a success

    We got through it. And I don’t mean got through it like the NFL is boasting getting through 17 weeks of football in 17 weeks. We got through it by playing when we could, and cancelling when we had to. Yes, there were cancellations, but rightfully so. It is a good thing that we cancelled games when there was an outbreak, and didn’t try to play through it. That should be celebrated.

    Kids got exposure for the NFL. This is a benefit that only affects a select few, but undoubtedly, there were new stars made this year that may have missed their shot if they graduated without playing their last season.

    It probably didn’t make much a difference in the grand scheme of the pandemic. It’s hard to point the finger at college football and say they did anything egregiously worse than the rest of the country. We’re all just trying to get by. If everyone else was quarantining and college football was trudging on, then that would be a different story. Dr. Doug Aukerman, senior associate athletic director for sports medicine at Oregon State, argued that college athletes were incentivized to be good followers of COVID safety protocols by being able to play their sport as the reward. I don’t disagree with that logic, and fans and other students may have bought into mask wearing when they saw Nick Saban, Trevor Lawrence, or their local campus stars wearing theirs around campus and in-press conferences on national television. They were probably also negatively influenced by seeing Dabo Swinney and many other coaches pull their masks down every time they had something to say, or perhaps it was just amusing.

    Fans stayed home on Saturdays and watched college football. Depending on who you ask, ratings are up or down this season compared to 2019, but likely down due to cancellations and teams not playing, or playing shortened schedules. For the National Championship, the ratings were the lowest since 2004. Despite the ratings, there was a group of fans that chose to stay home and watch college football on Saturday, who may have otherwise tried to go out and find something to do to cure the boredom.

    Now, a few caveats. Watch parties would be counterintuitive to my whole point, and those surely occurred, but hopefully at a much lower rate, or distanced and outdoors. There were, of course, fans in-person at many games as well. Sporting events mean crowds, shouting, and strangers: two of which the CDC lists as risk-factors. Shouting has also been labeled as an unsafe behavior. The one benefit is that games are held outdoors.

    In addition, we’ve seen plenty of chin-mask or maskless fans on TV, the mass celebrations that occurred after Alabama won the National Championship this week, and Notre Dame students rushing the field after upsetting Clemson. To Notre Dame’s credit, every student appeared to be wearing a mask, and my quick review of Notre Dame’s COVID cases didn’t show any notable spike in the weeks after that game. The same can’t be said for Alabama fans, many of whom were maskless since they weren’t in a controlled environment like the Notre Dame fans were.

    Finally, there are other ways to keep people entertained on the weekends that don’t rely on compromising the wellbeing of 18-22 year old amateur athletes. The NFL could have easily taken over Saturdays and spread their games across the entire weekend slate. That would have probably drawn more viewership than college football could, while still keeping the masses entertained all weekend without it being at the expense of unpaid student-athletes.

    It funded athletic departments and kept thousands across the country employed. Whether it meant employees of the university continuing to get paychecks, or local businesses seeing a little business in town with a small crowd, as opposed to no business whatsoever: college football propped up economies across the nation. Smaller, revenue-losing sports were kept alive in some cases. Not to mention the networks and their employees who had content on Saturdays, articles to write, shows to produce, and ad space to sell.

    Why the 2020 season wasn’t worth it

    A lot of players got COVID, and we don’t know what that means for them in the future. Not six months from now, or six years from now. We have seen studies showing increased risk of heart conditions, brain fog and other ailments lasting many months after infection, and more.

    Athletes (generally, based on my analysis of the Big Ten) got COVID at a higher rate than their peers, meaning that it was not indeed safer to play sports than to not play, as many argued. And how could it be? Would you feel safer in a spread out classroom (or much more likely, in your dorm on Zoom) with a mask on, or huddled up in the locker room celebrating post-game? Many schools implemented regular random testing, returning positive rates of around 1% at schools like Penn State, Alabama, and Clemson. Even during the worst parts of the pandemic (read: now), the positive rate is around 15% nationwide.

    However, we’ve seen how quickly COVID spreads in a locker room. Ed Orgeron notoriously said “most our players have caught it”, without citing any data. The Clemson locker room had an outbreak almost immediately when they got back on campus, with 23 players infected. On a roster of about 100 players in CFB, that’s a 23% positive rate. This is clearly higher than the rate of spread that casual students on campus were experiencing (the Clemson positive rate currently, even during the new height of the pandemic, is only 2.5%). Athletic departments in the Big Ten with complete datasets averaged around 8% of all cases at their respective universities, ranging from 2% of all cases to 21%, much more representative than their makeup of the overall student-body in most cases, with most Big Ten schools having somewhere between 40,000 and 60,000 students.

    They also probably gave it to their peers, where it slowly leaked out and decimated vulnerable residents in college towns. It’s impossible to know how many other people these players potentially infected. Nobody is writing headlines about the roommate of the college football player who is in the ICU, or mother or Aunt or professor. It’s a rolling ball that just keeps growing.

    While infection rates, hospitalizations, and deaths among university students were low compared to the general population, the same can’t be said for those living in the surrounding areas who were at higher risk. All it took was a few interactions between student and townie to send the virus through a college town.

    Players and teams that wanted to play, didn’t feel that way so much by the end. As seen by the bowl game opt-outs (at least 21 teams formally opted-out, forcing 16 bowl games to be cancelled), and a post-mortem done by Sports Illustrated, the enthusiasm was high at the start of the season, and quickly dwindled, a feeling we can all probably relate to. That being said, at least one player interviewed said it was 100% worth it despite their disinterest in competing beyond the regular season.

    Kids were forced to make extraordinary sacrifices. Not seeing family or friends for months at a time. Being deemed “essential” employees as student-athletes. People will argue it helped their chances at the NFL. Most will not play in the NFL. People will say they were given the chance to opt-out without consequence. When there is uncertainty, and no guarantees from the NCAA, that your scholarship will be waiting for you next year instead of handed to an incoming freshmen, is that really without consequence? Coaches were also caught telling kids to hide symptoms, as detailed in a report with mixed conclusions and no consequences.

    Coaches, ADs, even parents, also actively lobbied their conferences to return to play because their kids wanted to play. A lot of people also want to dine indoors, open up bars, or beat COVID via herd immunity. However, kids (and many adults, as we all now know), don’t always know what’s best for themselves, or others around them. So listing “the kids want to play” as a reason to play is irrelevant during a pandemic. People want to do a lot of things they shouldn’t do.

    Coaches COVID-shamed other programs. Most notably, Dabo Swinney claiming Florida State blamed COVID to get out of a matchup between the two teams. This type of squabbling, as thousands died each day, belittled the seriousness of the pandemic.

    There were a lot of prime-time blowouts. It certainly felt that way, at least. But was it an unbalanced season? The actual margin of victory in 2020 was nearly 2 points less, at 17.2, than it was in 2019 at 19.1. But that could be due to the elimination of most blowout non-conference games. So when excluding non-conference games, 2020 still had a 0.5 point advantage over 2019 at 16.1 points. However, when you look at the start time of games, the 8-9 PM Eastern Time games (primetime) in 2020 had the largest margin of victory at 23.8 points. So we can agree that the primetime games sucked this year, but let’s not say the whole season was that way.

    While the primetime games were blowouts, the overall 2020 season was actually more competitive in terms of margin of victory than last year.

    The scheduling differences made the race to the Playoff more unfair than normal. A 7-0 team played a 12-0 team in the National Championship. I’m not saying they didn’t deserve to, but a lot of people didn’t like seeing that, and I don’t blame them. A lot of good teams got left out, which is an issue that goes beyond just 2020. And viewers made their opinions heard by not watching, whether because they didn’t like the teams, or thought it was going to be yet another primetime blowout.

    We lost a college football player to COVID-19. I wrote at the beginning of the season that if we lost even one player to COVID-19, it would not be worth it. Now, from what they know, it sounds like the infection was linked to a party, and not a football activity, so I don’t think it would be fair to attribute this to college football in any way. His team was not playing in the Fall, and students were going to return to campuses whether football was played or not. Still, this is of course very sad to hear.

    Jamain Stephens Jr., a defensive lineman for California University of Pennsylvania, died from a blood clot in his heart after contracting Covid-19. “I’m very, very nervous for these young men and women … These kids, their lives are priceless. And it’s just not worth it,” his mother, Kelly Allen, told CBS News.

    This excludes high school football, which I would argue was many times more dangerous given the number of high schools there are for each individual D-I program out there. Several high school coaches have lost their lives from the virus. And high schools don’t have the resources to test their athletes like these colleges do: without rapid and regular testing, college football likely wouldn’t have been feasible.

    So was it worth it?

    I feel guilty, like my enjoyment of the season came at the expense of young athletes’ wellbeing, and potentially people’s lives. It’s the same way I feel when I eat out at a restaurant and shamefully remove my mask while a minimum-wage server takes a deep breath and comes to wait on me, praying I won’t be rude or ill. “I’m supporting local business. She’s glad that I’m here. It’s better than the place being empty.” But my dollar is just as good picking up takeout without putting her or other diners at risk, so why am I here? It’s the guilt we battle with every day.

    I stand by my statement at the beginning of the season: if we lost even one player, coach, or assistant from COVID that could have been avoided by not playing football, then it was not worth it. Luckily, as far as we know, no college football program lost someone due to COVID-19, despite the large number of infections. I cannot definitively say that for all college sports, but that’s something to be thankful for.

    The waters have been muddied so much by the irresponsibility of the nation as a whole that it’s impossible to point the finger at college football and say “this is your fault.” With that being said, we’re all just doing the best we can to get by. And college football helped a lot of people—not just players, but staff, employees, cameramen, analysts, fans, and myself included—get through a very rough part of 2020.

    A lot of bad has come from this year. A lot of bad has come from college football. But in a year where we’re all searching for what little bit of good we can find each day, college football delivered some of that too.